Analyzing the number of consumers who visit the establishments of any retail company, establishing the days and hours of greatest affluence and comparing it with competing sales points, is possible with Big Data techniques that allow the collection and analysis of large volumes of mobility data.
The millions of anonymized data generated every second by cell phones in all markets around the world make it possible to make increasingly accurate estimates of the levels of customer traffic received by commercial establishments.
Using innovative Big Data tools and the application of appropriate methodologies, in addition to determining the levels of customer traffic in commercial establishments and estimating their consumption capacity, it is also possible to infer consumer movement patterns.
See:”Geospatial Data to Optimize Supply Chains“
PREDIK Data-Driven carried out a comparative analysis of the levels of affluence reported in the establishments that in the State of California, USA, are operated by the hardware store chains The Home Depot and Ace Hardware.
For this study, the data generated during 14 days by the cell phones of consumers who visited these establishments was used.
The study’s fact sheet specifies that, in order to create the report on the behavior of visitors to the hardware stores under analysis, almost 40 thousand observations were obtained.
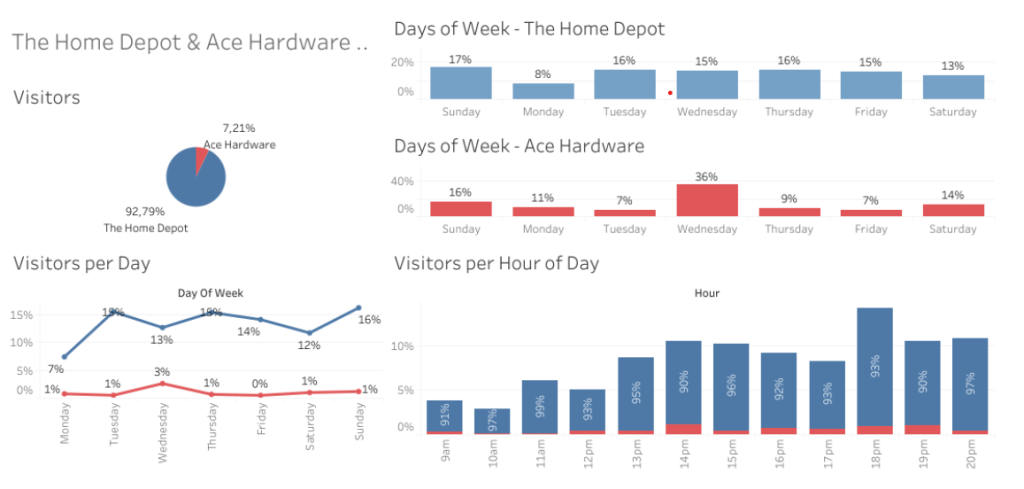
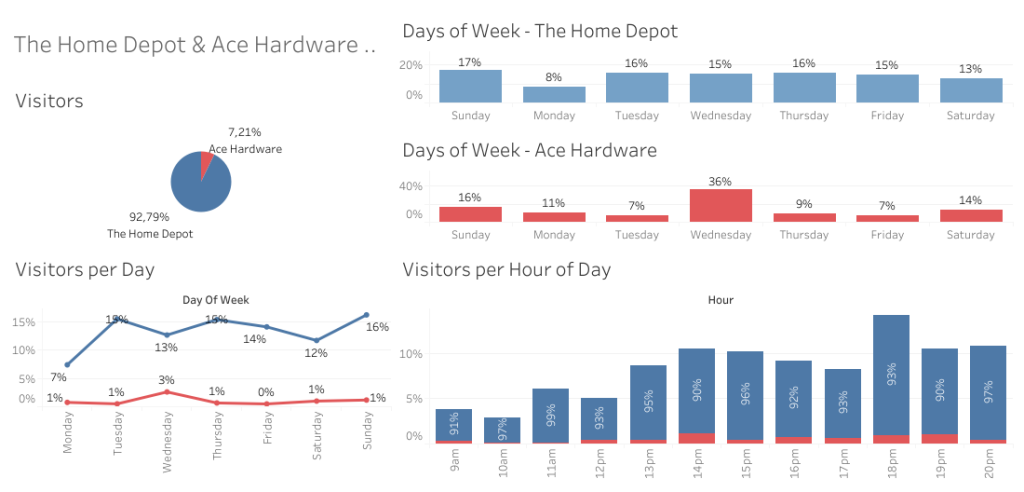
Details of some of the main findings:
-The highest levels of affluence at The Home Depot are reported on Sundays, Tuesdays and Thursdays.
-The highest levels of affluence at Ace Hardware are reported on Sundays and Wednesdays.
-From 6 p.m. to 8 p.m. is the time when most people visit The Home Depot stores, and in the case of Ace Hardware, its stores have the highest affluence at 2 p.m.
-From the 40 thousand observations, it was established that out of every 100 consumers, 93 visit The Home Depot and 7 prefer to go to Ace Hardware stores.
[button button_text=”Like what you see? Request a free DEMO” button_style=”style-1″ button_arrow=”true” button_rounded=”true” font=”Default” button_size=”medium” font_size=”” button_icon=”” button_align=”center” padding_v=”” padding_h=”” button_link=”/request_demo/” link_open=”_self” href_title=”” id=”” class=”” bg_color=”” text_color=”” border_size=”” border_color=”” border_radius=”” h_bg_color=”” h_text_color=”” h_border_size=”” h_border_color=”” h_border_radius=”” margin_top=”” margin_bottom=”” margin_left=”” margin_right=””]
This is just a fragment of a business solution, which can be more detailed and in-depth, since it is possible to combine the records generated by cell phones with other types of complementary information.
Contact us to get more information about our business intelligence solutions
