A competitive analysis begins by defining the target and its scope, exploiting different sets of structured and unstructured data available thanks to innovative tools that help to identify and measure competing brands and estimate their sales.
With Big Data tools that help analyze large volumes of information like predictive models, location intelligence and mobility data, it’s possible to generate a competitive analysis, which consists of identifying the main competing companies and estimating their turnover, quantifying their potential sales, identifying gaps in the market, predicting the cost of developing new products, discovering trends, among others.
Also read: “Geomarketing: What every retailer should know”.
This analysis allows companies to create business strategies that help to understand how competitors operate, allowing to identify weaknesses that can be exploited to gain market share against the competition.
[button button_text=”Like what you see? Request a free DEMO” button_style=”style-1″ button_arrow=”true” button_rounded=”true” font=”Default” button_size=”medium” font_size=”” button_icon=”” button_align=”center” padding_v=”” padding_h=”” button_link=”/request_demo/” link_open=”_self” href_title=”” id=”” class=”” bg_color=”” text_color=”” border_size=”” border_color=”” border_radius=”” h_bg_color=”” h_text_color=”” h_border_size=”” h_border_color=”” h_border_radius=”” margin_top=”” margin_bottom=”” margin_left=”” margin_right=””]
How to estimate my competitors’ turnover and sales potential
Through predictive models and machine learning tools, retailers can get to know what is the turnover potential of a specific point of sale a competitor in a week, month or other specific period of time. Likewise, these models can be used to predict the potential of a point of sale to be opened. This is ideal to complement feasibility studies of new stores in expansion plans (site location).
You may be interested in: “Walmart vs. Soriana: Who wins at the point of sale?“
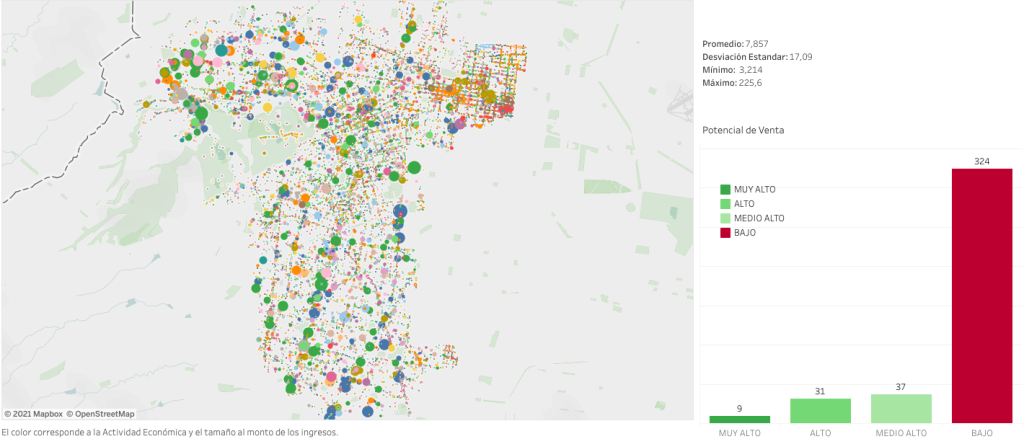
It’s also possible to estimate the sales potential in competitor stores in specific areas, generating mappings around a specific location or point of interest (POI) estimating the number of vehicles/people passing by at certain times of the day.
The analysis can be enriched by adding public information sources, to segment the different zones by income level of the commercial establishments in a certain area, socioeconomic data and purchasing power of the resident population and those passing through the area, among others.

At PREDIK Data-Driven we develop all kinds of business analysis for our clients. Learn more about how we do it.
Do you need an analysis to estimate the potential turnover or sales of your competitors? Contact us!

