Location intelligence and POI characterization through Big Data are increasingly being used to make business decisions in the retail, real estate, logistics, and port sectors, among others.
Businesses can leverage point-of-interest (POI) data to identify the population and customer patterns and trends, making smarter data-driven decisions.
In the retail sector, POI characterization allows marketers to identify a business’s market share, the spending power of people living or working in an area, demand for services or products, nearby competitors, or foot traffic in the area.
With this data, it is possible to generate advertising campaigns that are better adapted to consumers, by transmitting a more appropriate message to current customers and attracting new ones, increasing revenues and brand value.
In the public sector, it makes it possible to analyze and understand whether existing services or products are effective, whether they need to be improved and where to apply them.
In the real estate market, they provide specific information to consumers who want to rent or buy a property about the area surrounding that location.
In the transportation and logistics sectors they allow tracking fleet movements, managing routes, assessing the condition of transport infrastructure and reducing errors, delays, and loss of merchandise, minimizing last-mile cost with fast deliveries or by offering alternative pick-up points; mapping delivery and collection points, which help to create an overall, yet accurate picture of the areas served and to plan future additional points, where necessary.
Case Study: Categorization of the POI Zona Rosa, CDMX, Mexico.
At PREDIK Data-Driven we conducted a detailed study of a very active commercial area called Zona Rosa, in Mexico City. Through analysis and characterization of the area and the people who move around there, we estimated the pedestrian traffic, identified the most and least crowded places, classified the users who visit, live or transit through the area, the observations per day, the most and least visited places, socio-demographic aspects and specific places of interest.
In this case study we analyze the pedestrian traffic and the immediate surroundings of the point of interest, with the objective of identifying the behavioral patterns of the people who visit this area, the number of visits, their socioeconomic status, and to categorize and identify in which other areas of the CDMX the visits are distributed. This analysis aims to answer the following questions:
Which areas have the highest concentration and pedestrian traffic?
Generating a heat map that covers the entire POI analyzed, we identified that within the Zona Rosa, the areas with the highest pedestrian traffic are the main avenues in the center of the city, such as Paseo de la Reforma, Chapultepec Avenue, Eje 2 Poniente, and Insurgentes.
We can also observe that subway and bus stations such as Glorieta de Los Insurgentes, Sevilla, and Cuauhtémoc are some points where more pedestrian traffic can be identified.
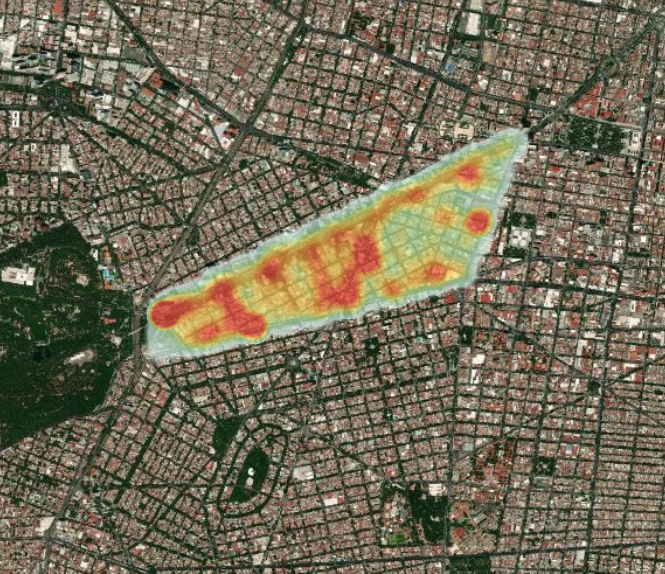
More specific locations such as the Torre Mayor, the Reforma 222 shopping mall, or the Insurgentes University near Bucareli Avenue are those that denote a more prominent concentration within the POI analyzed.
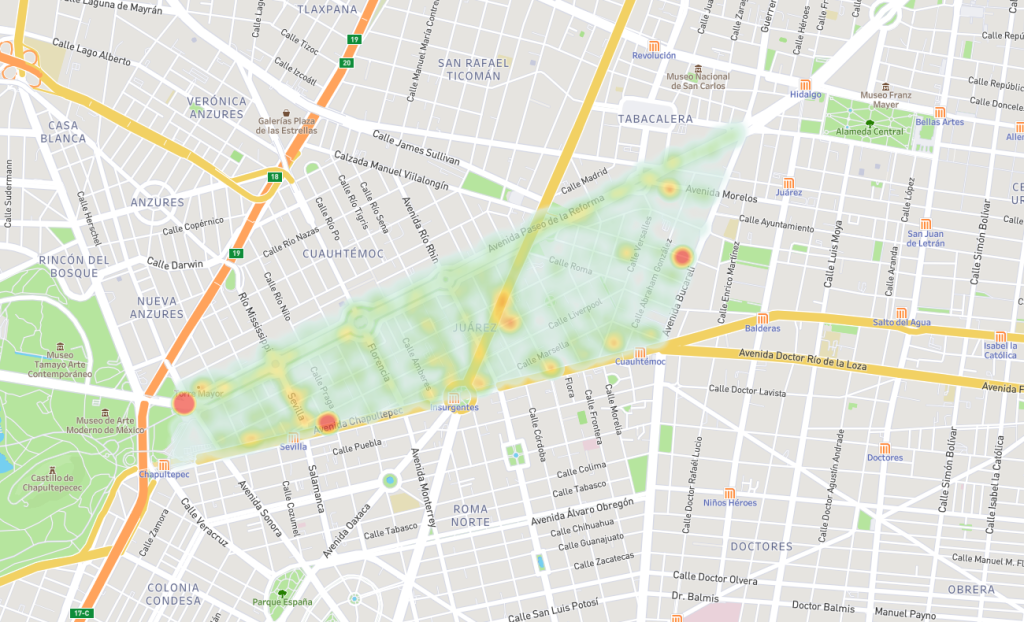
Something to consider is that by performing a series of mathematical calculations, it is possible to omit the vehicles from the analysis, which helps to generate more detailed information focused on the consumers and market in the area.
What is the estimated evolution of visits in Zona Rosa?
Through these analyses, it is possible to make a comparison of the evolution of visits identified during hours, months, days, and years of a POI, generating a detail of the average number of visits that helps businesses to have an idea of the market or the level of potential customers in an area, identifying seasons of high and low mobility.
[button button_text=”Like what you see? Request a free DEMO” button_style=”style-1″ button_arrow=”true” button_rounded=”true” font=”Default” button_size=”medium” font_size=”” button_icon=”” button_align=”center” padding_v=”” padding_h=”” button_link=”/request_demo/” link_open=”_self” href_title=”” id=”” class=”” bg_color=”” text_color=”” border_size=”” border_color=”” border_radius=”” h_bg_color=”” h_text_color=”” h_border_size=”” h_border_color=”” h_border_radius=”” margin_top=”” margin_bottom=”” margin_left=”” margin_right=””]
The distribution by the hour, day, month, and year is an important segmentation when characterizing and analyzing a POI, since it allows: estimating the times and schedules of certain premises or locations and knowing when they are more and less crowded, estimating the average time that certain records are spent in or near specific areas, finding the times of day that are more and less favorable to implement a product or service.
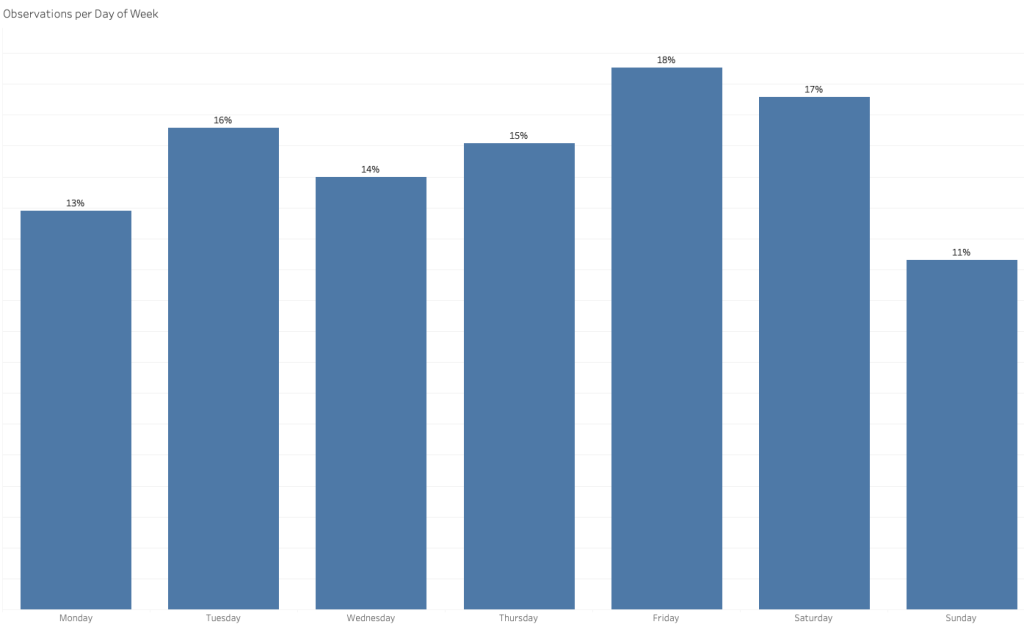
The ratio of observations per day for that month shows that the three busiest days of the week for the point of interest are Friday with 18%, Saturday with 17%, and Tuesday with 16%. All this helps businesses to get an overview of the market and the mobility of the area, allowing them to implement strategies that achieve their objectives more quickly and efficiently.
Zona Rosa is a point of interest where there are many bars, restaurants, and tourist attractions, it is not surprising that the highest percentage of visitation distribution is on Fridays and Saturdays.
What is the classification of people visiting Zona Rosa and what is their relative wealth index?
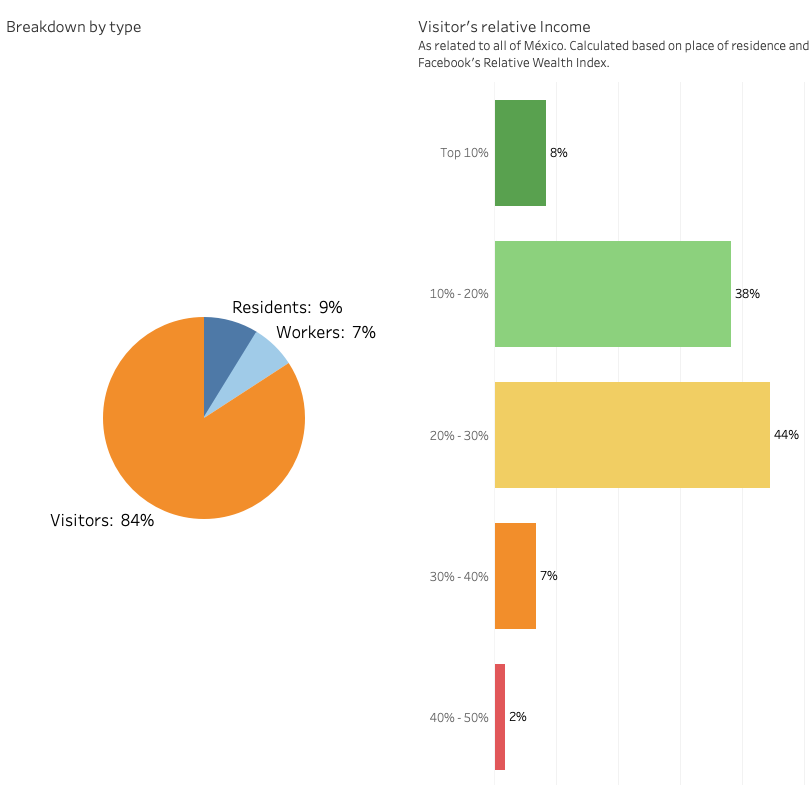
With a Global Wealth Index data layer, collected by Facebook, the socioeconomic levels of the inhabitants and their socioeconomic status were estimated. At the same time, applying geospatial data analysis techniques, we located corporate buildings, residential areas, schools, etc. The combination of these two analyses allows us to classify the inhabitants as students, workers, residents, or “floating or instantaneous population”, that is, people who only pass through that area to get to another location.
With this we were able to identify that 84% of the observations registered in Zona Rosa are visitors, 9% are residents and 7% are workers, all based on calculations of time spent and frequency of registrations in the area.
Based on Facebook socioeconomic level classification, we identified that 44% of the observations in Zona Rosa are of a medium-income level, 38% upper-middle, 8% high, 7% lower-middle, and 2% low.
How are the places within the CDMX categorized and how are the visits distributed?
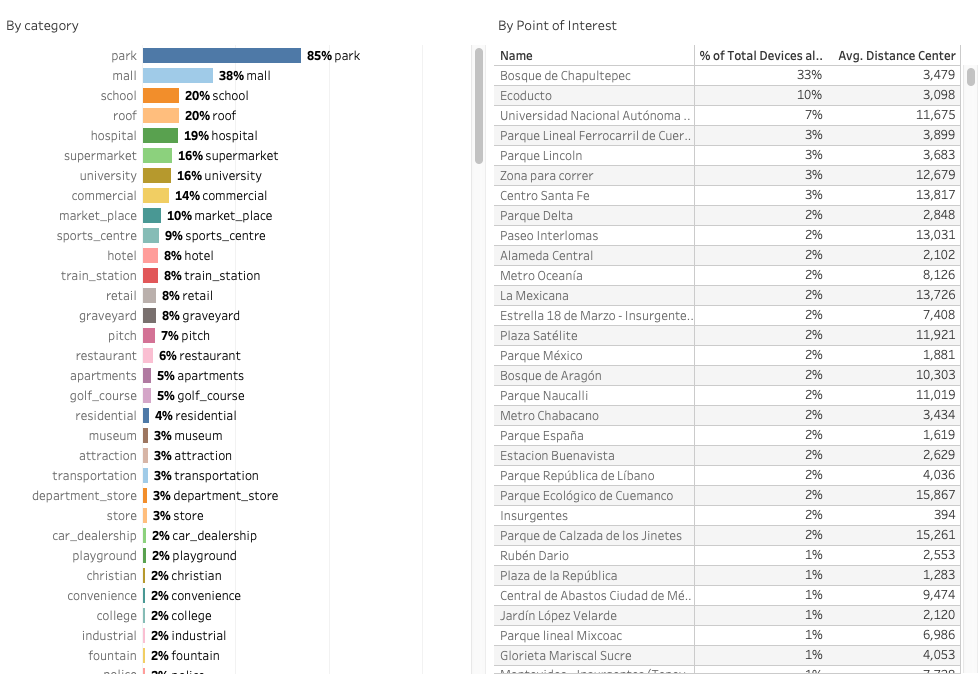
The points of interest identified in the area were also categorized to understand the behavioral patterns of the inhabitants and thus identify potential markets and places that generate more interest.
A general analysis of the CDMX shows that the Bosque de Chapultepec is the place where the most visits were registered, followed by the Ecoducto Park and the UNAM (National Autonomous University of Mexico), and in line with the analysis, we can see that both the areas characterized as parks, shopping malls and schools are the locations where the largest number of records are found in Mexico City.
Thanks to the frequency of updates, coverage, ease of use, and consistency of the data, these analyses help determine where to build new infrastructure (site selection). At PREDIK Data-Driven we help our clients understand consumer behavior patterns, study the competition and understand user needs by geography.
Do you need to implement a POI analysis to benefit your business? contact us!

