
Mobility analysis has become one of the best tools to optimize business strategies and expansion plans in retail. For convenience stores, this is no exception.
Understanding what consumers think, want and do is essential for companies in the retail sector. This is where big data tools play an important role, because with them you can measure not only the influx at the point of sale, but also the characteristics of the customer and their consumption patterns.
Case Study: Oxxo Vs. 7-Eleven, Mexico City
Using mobility data and other sources of information, at PREDIK Data-Driven we carried out an exhaustive analysis of two popular convenience stores in the Mexican capital: OXXO and 7-Eleven.
In order to understand the behavior of customers inside the store and in the immediate environment, we carry out an analysis based on mobility data.
It is possible to evaluate pedestrian flows from a given area or place using big data engineering, and then depict the performance of a point of interest (a specific POI), such as a convenience store, by combining this information with geospatial data.
OXXO Vs. 7-Eleven: analysis of two competitors
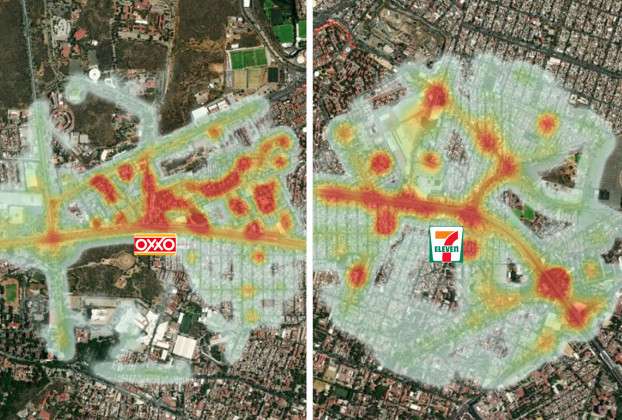
Mobility data within the two stores and in the immediate environment was analyzed, with the aim of comparing and analyzing the movement of visitors in the two points of sale. To do this, mobility data was collected and analyzed to understand the behavior of people who visit stores. This analysis aims to answer the following questions:
How are the visits to each establishment distributed?
The first step is to determine the two points on the map and select the area that we are interested in analyzing.
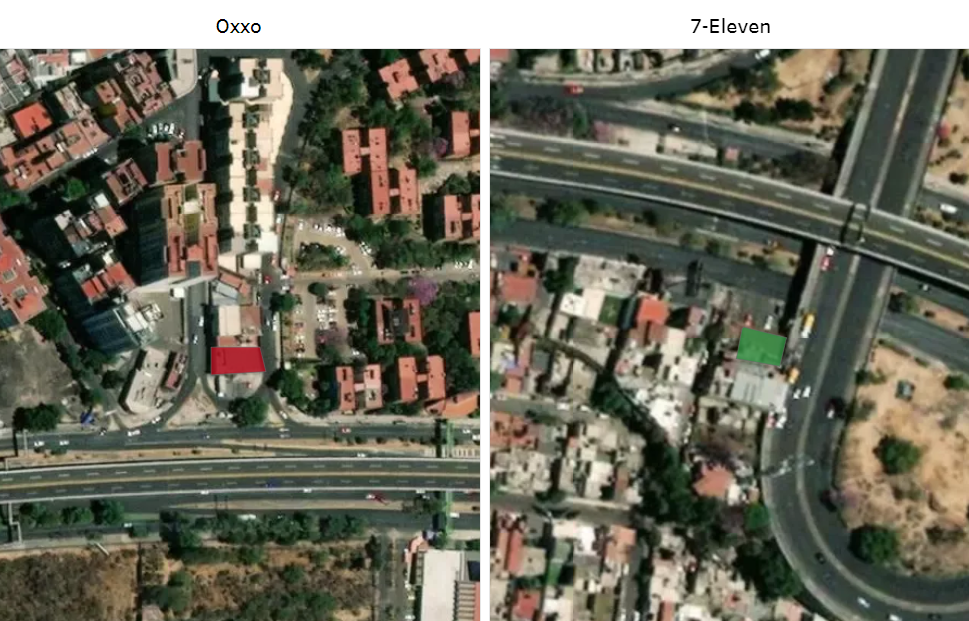
This environmental analysis gives us a more broad picture of the surrounding surroundings as well as the mobility patterns of the people that move around. When these data are joined with other criteria, they provide a wealth of information for projecting the revenue of any business.
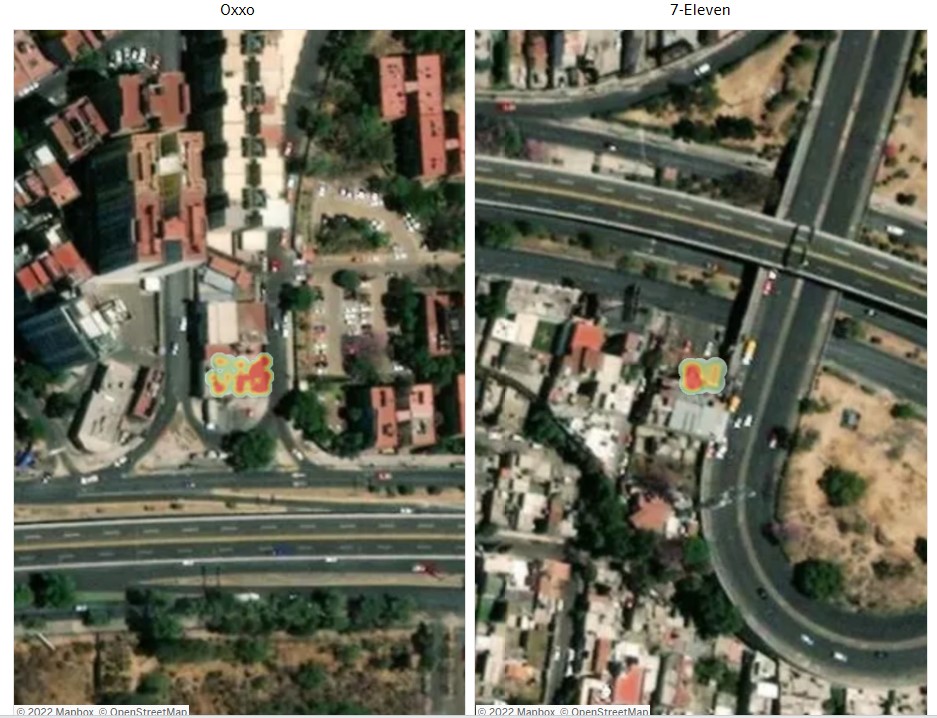
In-store analytics
Using geospatial data analysis techniques, points of interest are identified and a heatmap is calculated, based on the mobility patterns of visits, allowing analysis of the dispersion of consumers and the distribution of visits in inside both stores.
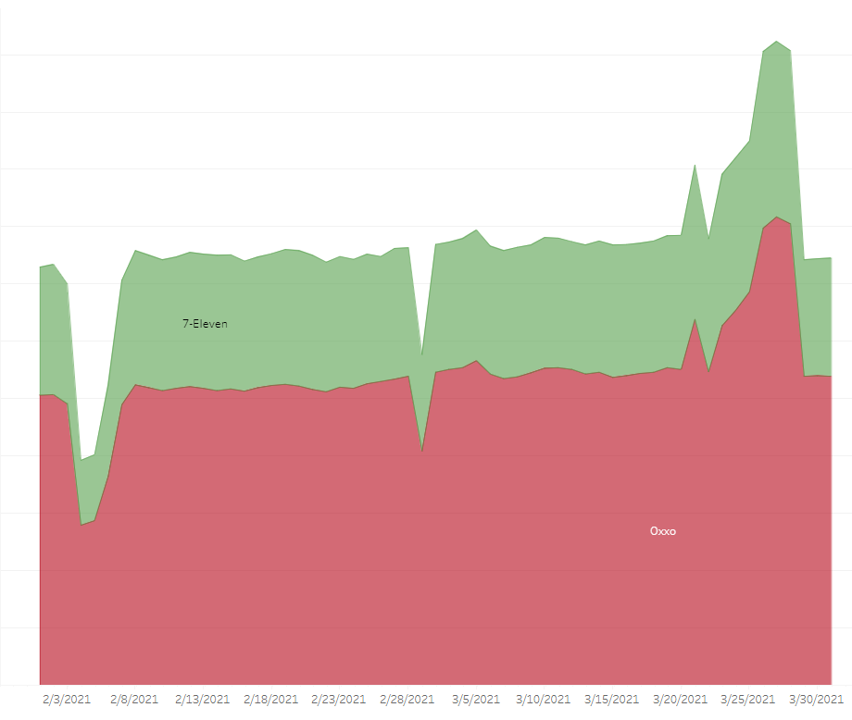
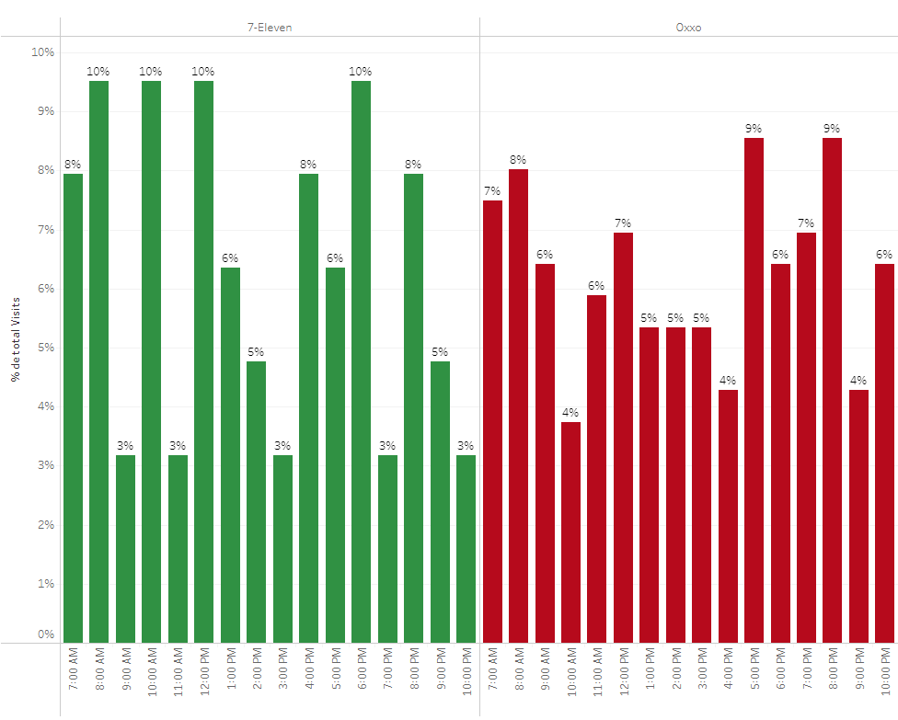
What was the evolution of the visits to the two stores in the analyzed period?
Once the data has been collected, it is possible to observe the evolution of visits over time, which can be very useful to identify patterns of customer behavior and market trends in high and low seasons.
The graph below shows the percentage distribution of the visits registered during February and March 2021:
Identificar la conducta de los consumidores: ¿Qué días de la semana son los más visitados?
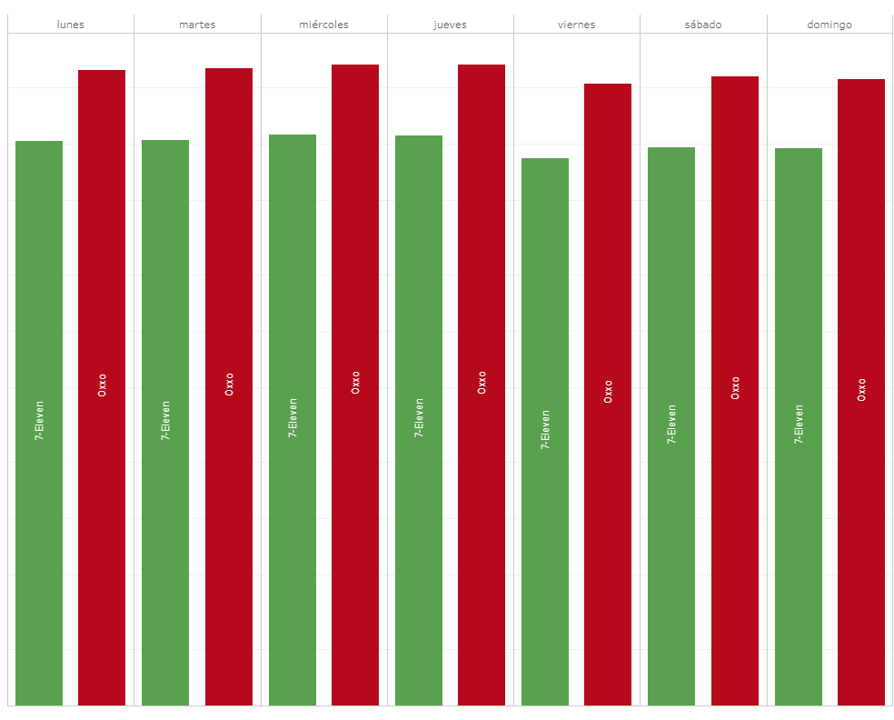
One of the most interesting applications of geomarketing is that it allows knowing details about daily, monthly or annual consumer behavior models, providing valuable knowledge of the design of marketing and battle campaigns. A commercial mix of power time in the store.
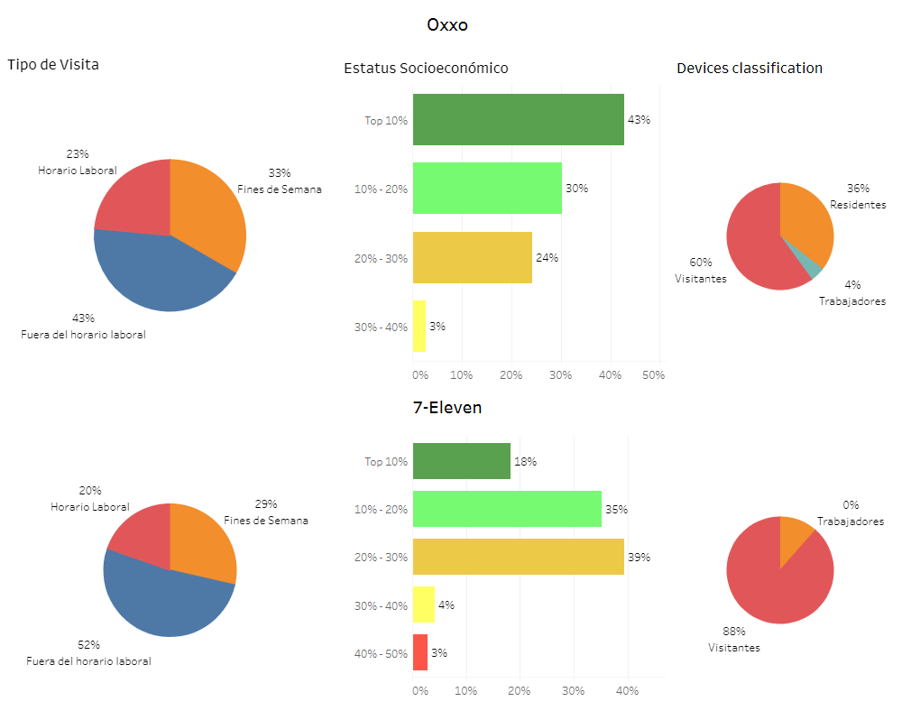
Customer profiling: What are OXXO and 7-Eleven visitors like?
Cuando enriquecemos el análisis incorporando otras fuentes de información, los insights que generan estos estudios se vuelven de gran valor para optimizar no solo los planes de expansión y búsqueda de zonas para nuevas aperturas, sino también para perfeccionar las estrategias de comercialización y marketing en cada punto de venta.
You might also be interested in our case study: «Foot traffic Analytics: Burger King Vs. McDonald´s«
Identify suitable areas to open new points of sale
Through these analyzes it is possible to go one step further in the analysis, and not only count how many people enter the store, but what those people are like.
Are they our potential customer? Do they have purchasing power? How long do they stay in the store? What preferences do they have? What other establishments do they visit? Where do they come from?
With data from the Global Wealth Index, compiled by Facebook, the socioeconomic levels of the inhabitants, their age and their profile can be estimated. In parallel, applying geospatial data analysis techniques, corporate buildings, residential areas, schools, etc. are located; which makes it possible to clearly understand the behavior of the people who pass through a certain area, understand what they are like, their tastes, preferences, socioeconomic level and purchasing potential.
You can also read: «Branch expansion with predictive analytics»
What is my competitor’s or a point of sale’s billing potential?
Thanks to machine learning models, it is possible to predict the sales of a particular point of sale. With these models, any company can get an idea of the possible income or visits of a competitor in a given week, month or year. These patterns are also used to predict the chance of a new venue opening. It is ideal for conducting feasibility studies of new points of sale in site selection plans.
