Big Data is the immense volume of structured and unstructured data that floods a business daily. But it is not the quantity that matters, but what organizations can do with all this data.
The importance of Big Data relays on its ability to obtain high-value insights.
Before learning everything about Big Data, here are some statistics:
- By 2025, the global Big Data market could reach USD $329 Billion
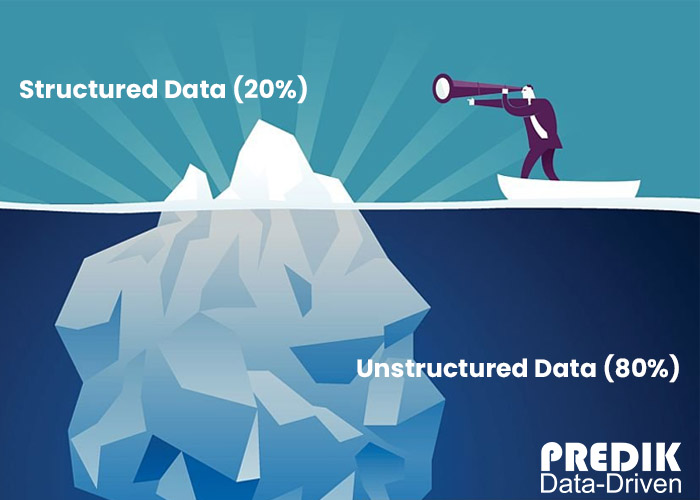
- 80% of data is unstructured, and only 20% is structured.
- The volume of data created and replicated will reach 180 zettabytes by 2025.
- By 2020, the number of IoT devices was projected to reach 20.4 billion.
- 85% of data is dark data, meaning organizations collect but do not use it.
Now, this is what we will explore in this guide:
- Why is Big Data so crucial for businesses?
- The use of Big Data across industries
- A little bit of history
- What is Big Data Analytics?
- The 5Vs of Big Data
- Understanding the different types of data
- The role of alternative data on Big Data
- How Big Data works: The five-step process
- What to expect from Big Data in the future?
Why is Big Data so crucial for businesses?
Big Data analytics and processing have become the norm in many industries like healthcare, finance, retail, and manufacturing.
Using Big Data for business decisions can give organizations a significant competitive advantage. By gaining insights from big data, businesses can make more informed decisions, improve operations, and better serve their customers.
For example, a retail company can analyze customer purchase data to identify trends and make more accurate inventory decisions. The result? A significant reduction in waste and increased profits.
Companies that use Big Data are seeing benefits like:
- Improved customer experience
- Increased efficiency and cost savings
- Improved decision making
- Enhanced competitive advantage
- Improved product and service innovation
- Enhanced risk management
- Improved marketing and sales
- Increased revenue
- Optimized operations
- Better fraud detection and prevention
Improved customer experience: With the ability to analyze customer data, organizations can gain insights into customer preferences and behavior.
For example, companies can personalize promotions, optimize product recommendations, and improve customer service by analyzing purchase history.
Increased efficiency and cost savings: Companies can identify inefficiencies and bottlenecks in their operations. This can help to optimize processes, increase productivity, and reduce costs.
Improved decision process: Big data analytics can provide a complete picture of a business’s operations.
Enhanced competitive advantage: Organizations can make strategic business decisions using high-value insights. That gives them a competitive advantage over their rivals.
Improved product development and service innovation: Big data can provide insights into customer preferences and trends in the market. This promotes the invention and development of new products and services.
Enhanced risk management: By analyzing large amounts of data, organizations can identify potential risks and take steps to mitigate them.
For example, by analyzing financial data, organizations can identify trends that indicate potential fraud and take steps to prevent it.
Improved marketing and sales: Big data can provide information about customer behavior. This can help businesses to improve their marketing and sales efforts.
For example, brands can analyze data from social media and customer feedback. Doing this, they can better understand what its customers want and how to reach them.
Increased revenue: Companies can use data to increase efficiency, target customers, and increase sales.
Optimized operations: By analyzing big data, organizations can identify areas for improvement.
Better fraud detection and prevention: Big data analytics can identify patterns and anomalies that indicate potential fraudulent activity. This information can help organizations to take proactive measures to prevent fraud and protect their assets.
Big data technologies are used not only by large companies but also by small and medium businesses.
Nowadays cloud services are more available and storage costs of storage have decrease. This have made it more accessible for organizations of all sizes to collect, store and process large amounts of data.
The use of Big Data across industries
Companies are using big data across a wide range of industries. Here are some examples of the use of big data by companies:
Retail
Retail companies use Big Data to analyze customer purchase data to identify trends and make more accurate inventory decisions. This can lead to the following:
- Reduce waste and increase profits.
- Avoid supply chain inconvenients.
- Launch personalize promotions
- Optimize product recommendations
- Improve customer service.
Finance
Financial institutions are using Big Data to identify fraud and prevent financial crimes. They also use it to identify potential risks and develop predictive models that help them make more informed investment decisions.
Healthcare
Hospitals and other healthcare organizations use Big Data to improve patient care and reduce costs.
For example, by analyzing electronic health records, doctors can gain insights into patient health history. Health professionals can also identify potential risks, and make more informed treatment decisions.
Additionally, healthcare organizations can identify trends in disease outbreaks and improve public health.
Manufacturing
Manufacturing companies use big data to optimize their production processes and increase efficiency.
For example, manufacturers can analyze sensor data from machinery to identify inefficiencies and bottlenecks in their operations. Also, some companies are using Big Data to improve the design and quality of their products.
Telecom
Telecom companies use Big Data to understand better their customers’ usage patterns and behavior to improve customer service.
They also use big data to identify patterns in data traffic, identify potential bottlenecks and plan infrastructure improvements accordingly.
Energy
Energy companies are using big data to optimize their equipment’s efficiency and performance, predicting equipment failure and reducing costs.

A little bit of history
The origins of Big data date back to the 1950s. It was the first time large corporations and government agencies began collecting and storing vast amounts of data on computer systems. However, the time technology limited the ability to process and analyze this data.
The introduction of database management systems (DBMS) and data modeling techniques allowed organizations to store and retrieve data more efficiently. The problem relied on the limited amount of data that could be processed.
In the 1990s, the term “Big Data” was first coined. That was the decade of new technologies such as Hadoop and NoSQL databases. This allowed a more efficient way of storing and analyzing extensive unstructured data sets.
Companies could now handle too large, complex, or fast-changing data.
In the early 2000s, organizations began using Big Data to gain insights into customer behavior, improve operations, and drive innovation.
Present time: The rise of social media and the explosion of mobile devices have contributed to the rapid growth of Big Data. Machine Learning and Artificial Intelligence, have also played a major role.
What is Big Data Analytics?
Big data analytics refers to examining, cleaning, transforming, and modeling large data sets to discover helpful information, patterns, and insights.
Big Data analytics software can go beyond what traditional business intelligence and analytics platforms can accomplish. It can examine large amounts of structured and unstructured data to uncover valuable insights and information.
Compared to BI, which mainly focuses on managing data within an organization to improve performance and operations. Big Data analytics focuses on discovering patterns, trends, and customer preferences by analyzing raw data.
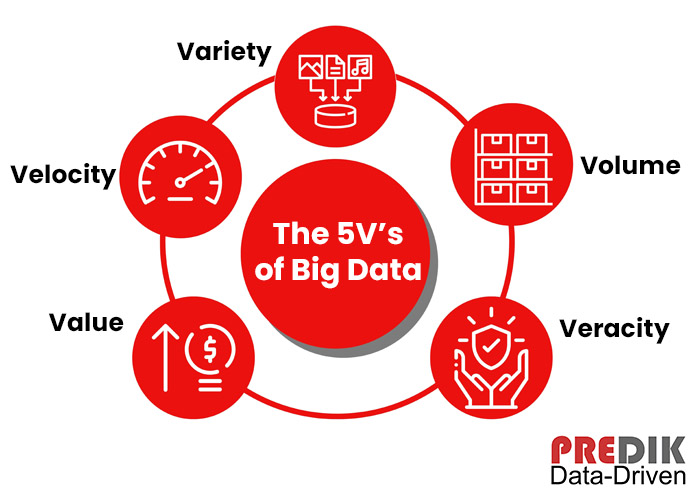
The 5Vs of Big Data
The 5Vs of big data refers to the five characteristics that define big data: Volume, Velocity, Variety, Veracity, and Value. These concepts were first introduced in 2001 by Doug Laney, an analyst at Gartner.
These 5Vs represent the challenges that Big Data presents to organizations. It also helps to understand the complexity of working with vast data sets.
Volume
Volume refers to the massive amount of data that is generated and collected. It is the most obvious characteristic due to the exponential data increase in the last years.
The volume of data can be so large that it exceeds traditional data management systems’ storage and processing capabilities.
Velocity
Velocity is the speed at which data is generated, collected, and processed. This aspect can include streaming data, real-time data, and data from social media and the internet of things (IoT).
The importance of real-time data: Real-time data refers to data generated and processed at the time of its occurrence. The “Real-time” aspect of data is essential to make quick and efficient decisions.
Variety
There are different types of data that organizations need to manage, such as structured, semi-structured, and unstructured data. This data can come from various sources, like databases, social media, and IoT devices.
Notice that Big data can come in many forms, such as text, images, audio, and video. This variety of data can make it difficult to process and analyze because different data types require additional processing.
Veracity
With Big Data, organizations must be able to trust their data accurary. Veracity also encompasses data quality, meaning the degree to which data is complete, accurate, and usable.
Value
Value refers to the potential insights obtained from the data.
Big Data analytics aims to uncover valuable insights for strategic decisions and competitive advantage.
Important: These five characteristics are not mutually exclusive and often interact. For example, when volume increases, velocity also tends to increase. Similarly, when variety increases, it can make the data more difficult to process and analyze, affecting veracity.
Understanding the different types of data
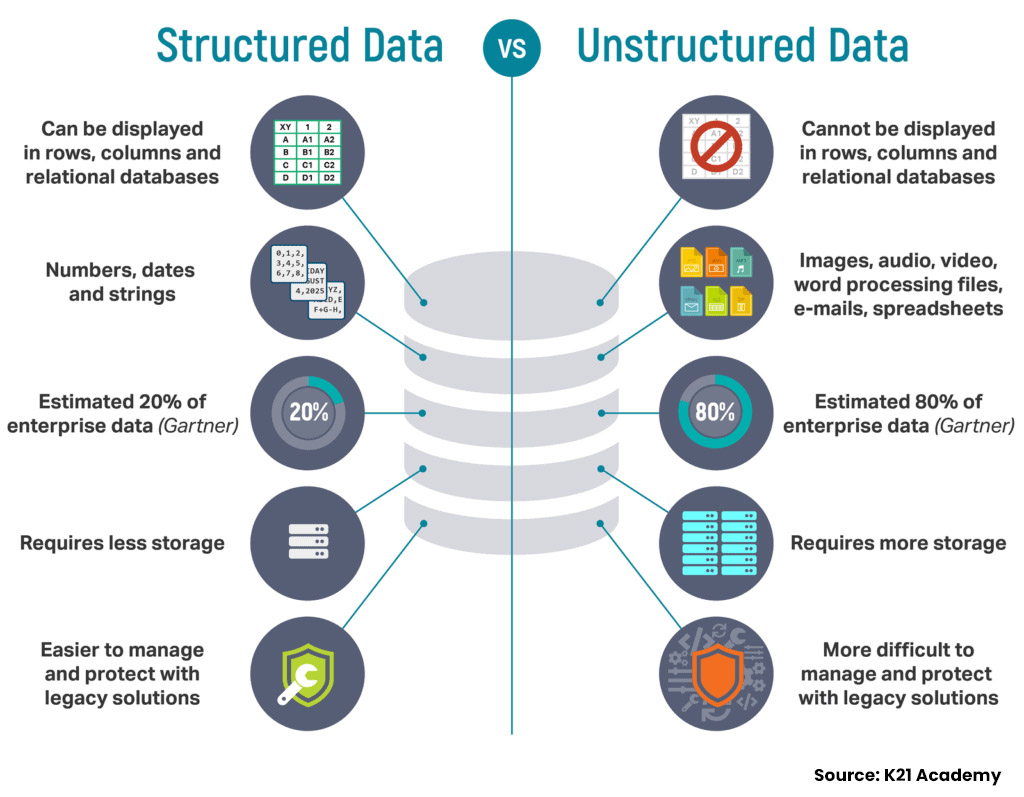
Big data can come in many forms, so they are classified in three categories: structured, semi-structured, and unstructured data.
Structured data
Structured data organizes in a pre-defined format, such as a database table or a spreadsheet. It is easy to process and analyze structured data because its structure is predictable and consistent.
Examples of structured data include:
- Customer information in a database.
- Financial data in a spreadsheet.
- Sensor data in a time-series format.
Semi-structured data
Semi-structured data is data that has some structure but also contains unstructured elements. It is more complex to process and analyze than structured data but not as complex as unstructured data.
Examples of semi-structured data include:
- XML and JSON documents
- Social media posts.
Unstructured data
Unstructured data does not have a pre-defined format and can be challenging to process and analyze.
Examples of unstructured data include:
- Text
- Images
- Audio
- Video
Unstructured data is the most complex to process and analyze because it requires specialized techniques and technologies.
Understanding the different types of data and the necessary technologies and techniques to process and analyze data effectively is essential.
For example, structured data can be analyzed using traditional relational databases and SQL. While semi-structured and unstructured data may require specialized technologies such as Apache Hadoop and Apache Spark.
On the other side, unstructured data require the use of natural language processing and computer vision algorithms to extract insights.
In summary, the difference between these three types of data is the level of structure and organization. Structured data is easy to process and analyze, while unstructured data is the most complex. Semi-structured data is in between the two.
The role of alternative data on Big Data
Alternative data is a term used to describe data not typically used in traditional channels. This data type is becoming increasingly relevant as it provides new and unique perspectives.
We recommend you reading: What is alternative data and what sectors does it benefit?
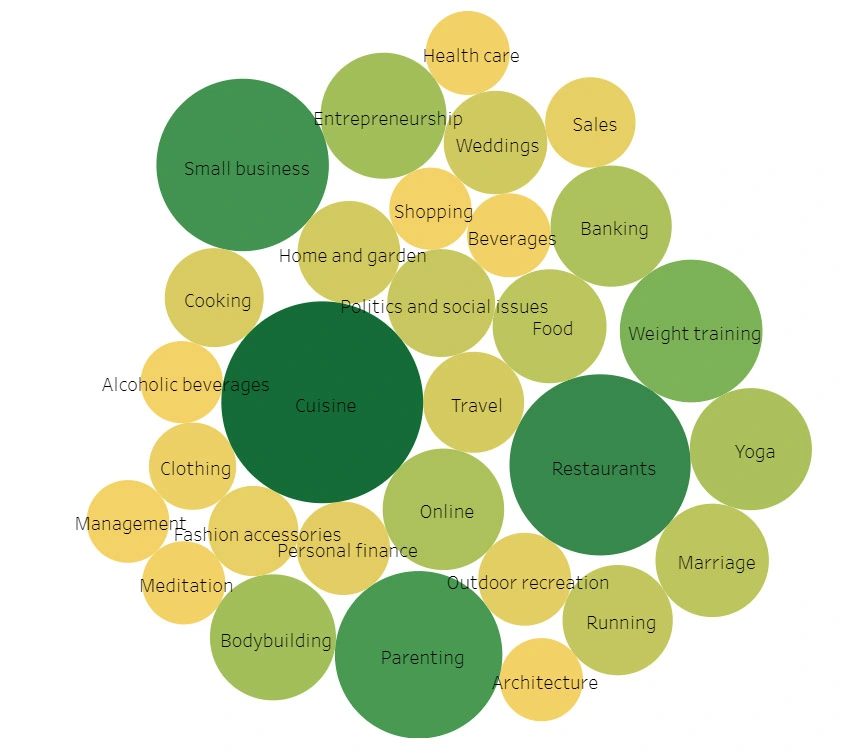
Social media data: Social media platforms such as Instragram and Facebook generate vast amounts of data.
Environmental data: Environmental data, such as weather patterns, can be analyzed to identify potential risks and opportunities.
For example, agricultural companies can use weather data to optimize crop yields and reduce costs. In contrast, insurance companies can use weather data to identify areas at risk of natural disasters and adjust their pricing accordingly.
Sensor data: Data generated by connected devices and sensors can be analyzed to identify patterns, optimize operations, and improve equipment performance.
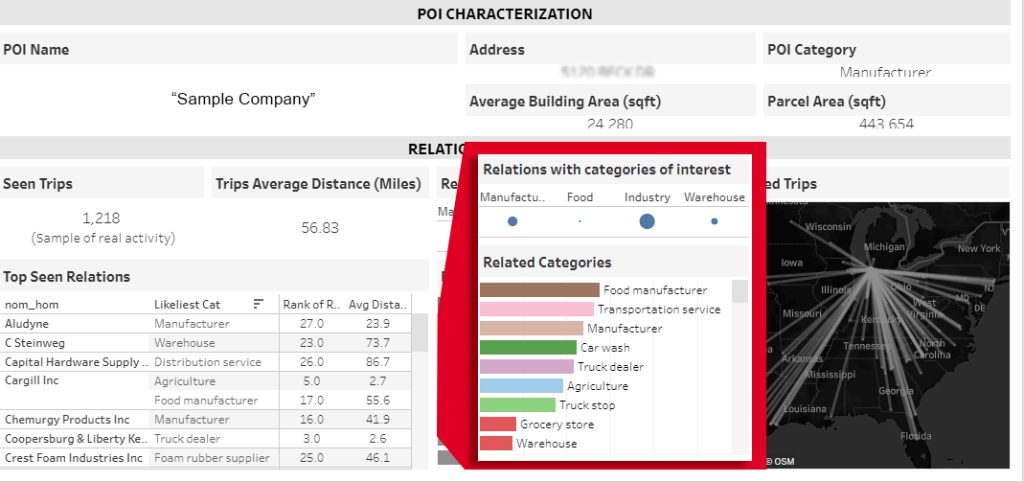
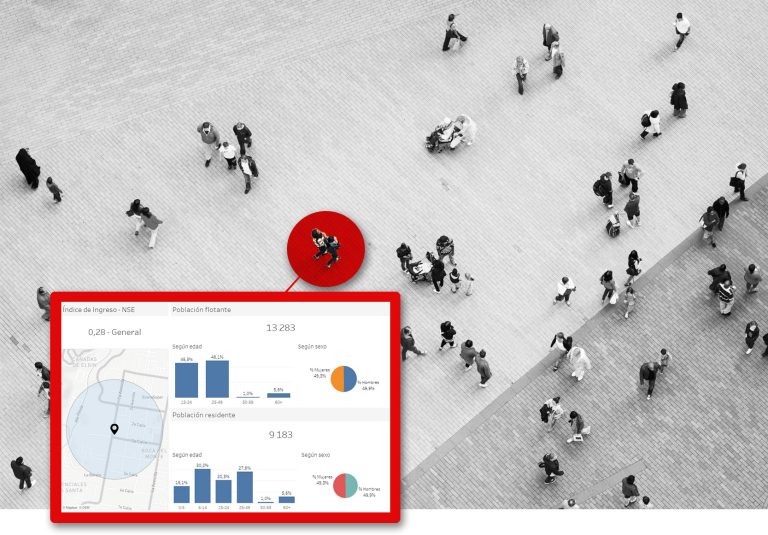
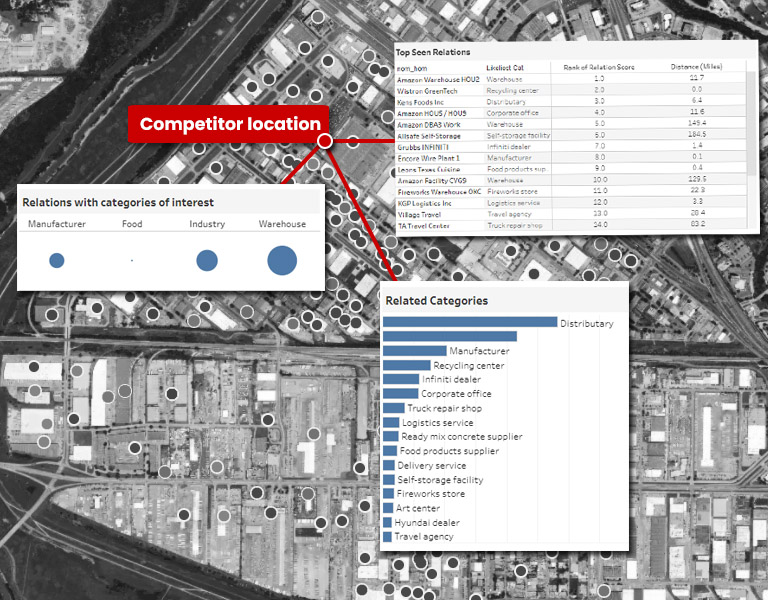
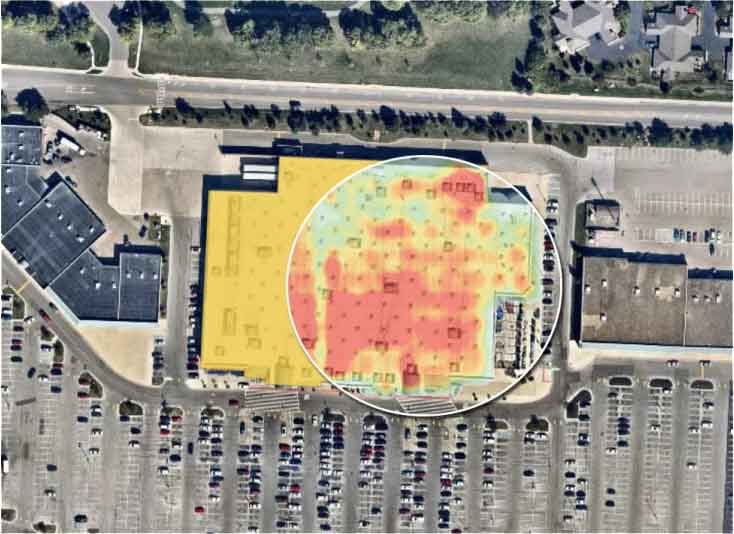
Location data: Location data, such as GPS data, POI and foot traffic, can identify patterns and trends in consumer behavior.
Web scraping: Automated collection of publicly available and open sourced data from company websites, job portals, news articles, etc.
Learn more: How to Get Useful Customer Behavior Analytics? (Guide)
How Big Data works: The five-step process
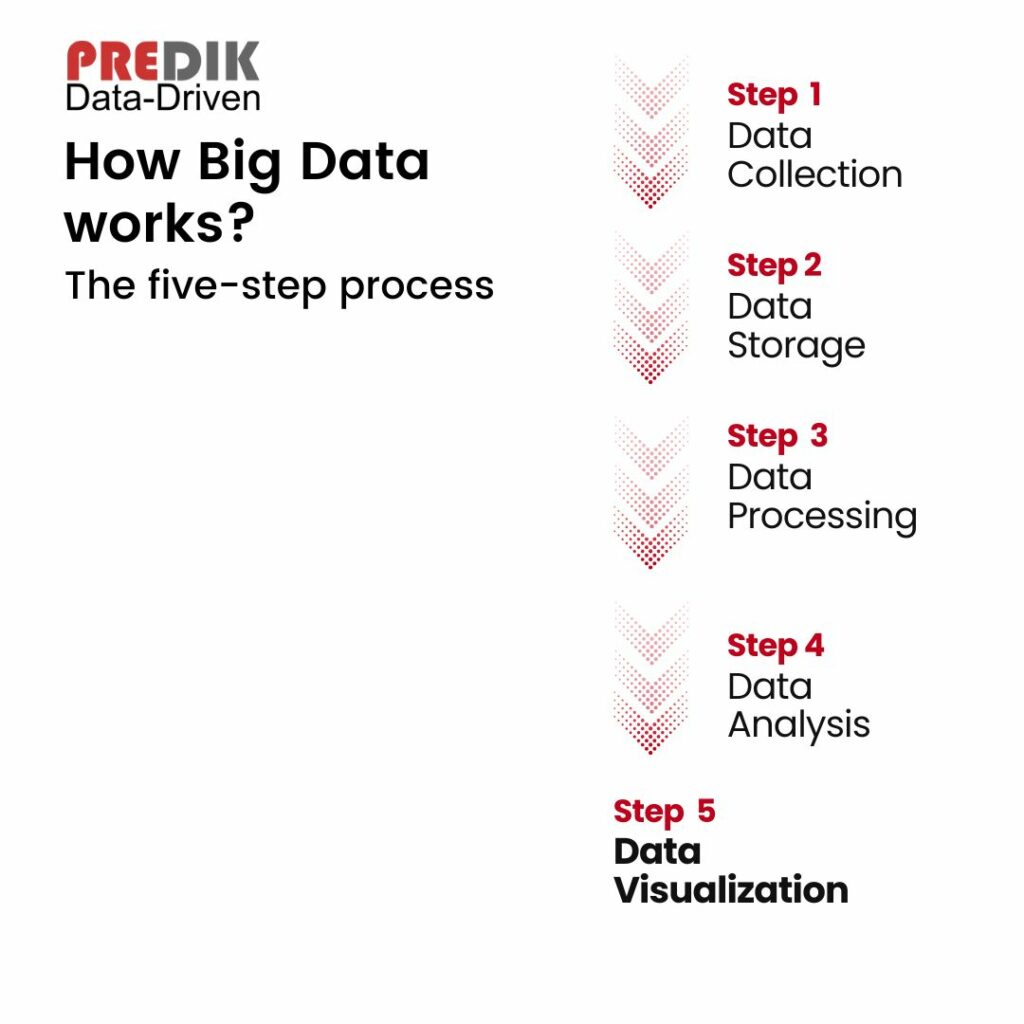
Big Data is not just about data volume but also how it is collected, stored, processed, and analyzed. Here is a step-by-step explanation of how big data works:
Step 1: Data Collection
The first step is to collect the correct data. Here is when structured, semi-structured, and unstructured data comes to play.
Step 2: Data Storage
Once the data is collected, it needs to be stored somewhere it can be accessed and analyzed.
Storage is typically done in a data warehouse or data lake. A data warehouse is a centralized storage for storing and managing structured data.
On the other hand, a Data Lake refers to a centralized repository for storing raw, unstructured data. Data lakes can store large amounts of data in various formats and make it more accessible for analysis.
Step 3: Data Processing
Before analysis, data needs to be cleaned and prepared for analysis. This process is called data processing. It includes tasks such as removing duplicate data, formatting it, and removing irrelevant data.
Data processing prepares the data for analysis and ensures the insights’ accuracy.
Step 4: Data Analysis
Once cleaned and processed, now data is ready for analysis. This step involves advanced analytics techniques such as Machine Learning, predictive analytics, and Artificial Intelligence.
The proper technique combination can uncover hidden patterns, unknown correlations, and other valuable information from the data. The insights gained from this analysis can provide helpful information to help organizations make better decisions.
Step 5: Data Visualization
The final step is to present the insights from the data analysis in a meaningful and coherent way. This step involves charts, graphs, and maps.
These tools make it easy to see the data’s insights and patterns and communicate them to others.
Data Governance
Data Governance refers to the process involving the management and decisions behind the data collection, storage, and usage. It helps ensure that the insights gained from the data are accurate and can be trusted.
What to expect from Big Data in the future?
We can expect an even larger role for businesses and organizations. The constant development of new technologies is making Big Data analytics more accurate, efficient, and accessible.
Big data are breaking ground within more industries and use cases, such as personalized medicine, smart cities, and autonomous vehicles.
The Internet of Things (IoT) will create even more data. Connected devices will increase 800% percent over the next four years. Emerging technologies such as AI, machine learning, and NLP will open the path for new products, user experiences, cost efficiencies, and more.