Predictive, location, and foot traffic analytics reveal valuable information that helps retailers to choose the right location when setting up geographic expansion strategies.
How are predictive analytics models used to determine the optimal location for a new facility?
Predictive analytics is a type of statistical analysis that uses data mining, statistical modeling and machine learning to extrapolate trends from historical facts and current events and is often used for risk assessment and decision making.
Today, this tool within retail, encompasses loyalty metrics, store size, consumer demographics, inventory management, product assortment, to understand your target market, differentiate your products and services, and determine the ideal locations to expand in a way that maximizes sales and customer satisfaction.
You might be interested in: “How to create the best branch expansion strategy?“
How do you get this data to train these models?
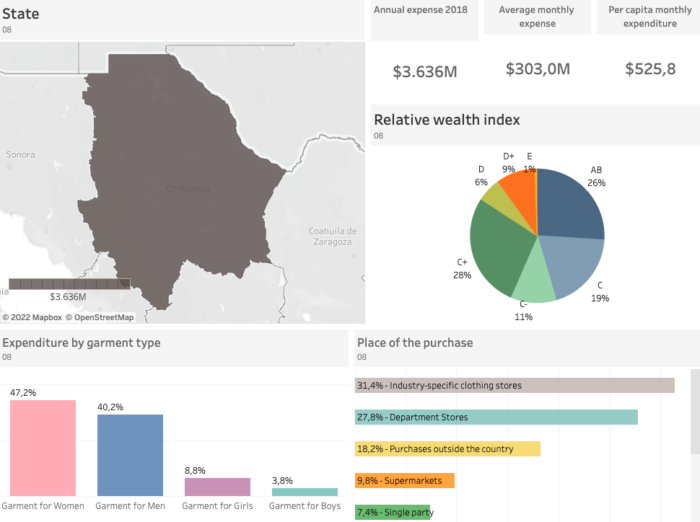
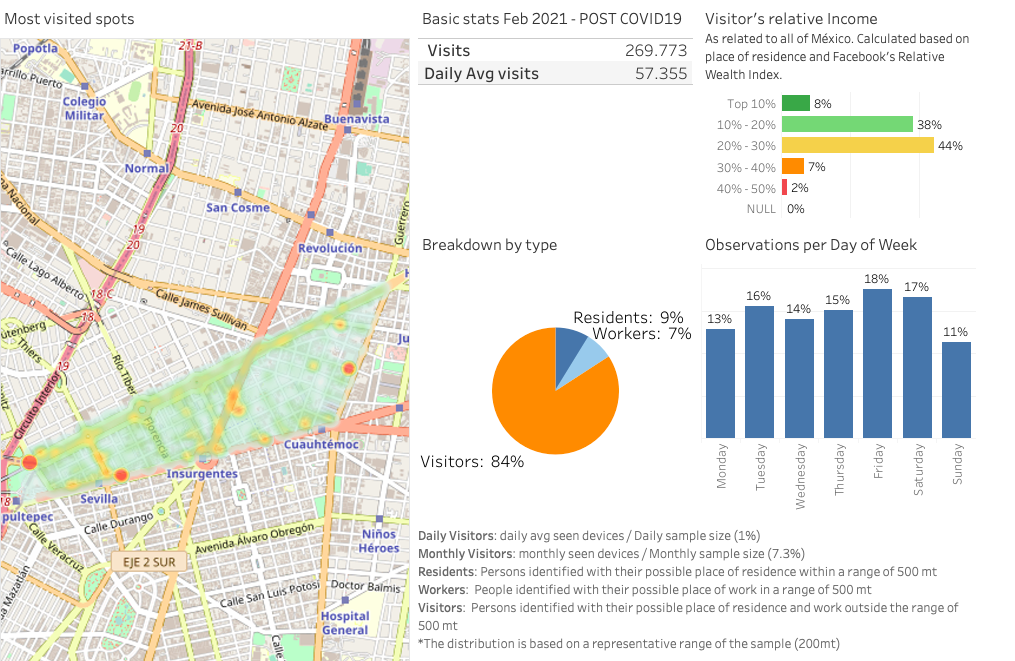
Retailers can find relevant data through location analytics, which uses GIS data to understand different geographic and spatial factors, while using statistical techniques to predict the best location for each store.
Other data used to train these models can include internal sales data, demographic details and population profiles. Other macroeconomic indicators are also used, such as the purchasing power of the population, the economic growth rate and the cost of opening new points of sale, among others.
The following steps are followed to identify the best location for each point of sale:
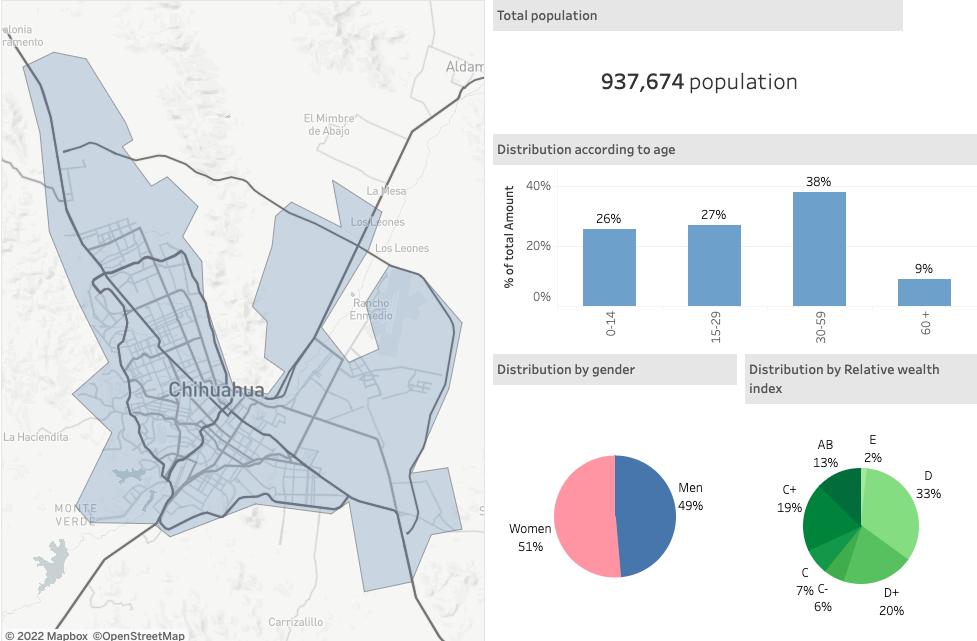
Step One: A wide variety of predictor variables are determined that can capture several demographic, economic, and location details at the zip code level while developing forecasting solutions. Some indicative variables are:
- Demographics such as total population by zip code, gender and occupancy status.
- Economic factors such as sales figures and house price index.
- Other data such as geographic or land information and competitor locations.
Step 2: This data is used to generate forecasts of store sales at the ZIP code level; the forecasts can be used to estimate potential revenue for each location.
Step 3: Outlet selection combinations are made at the ZIP code level to maximize profitability, while incorporating area-level constraints and listing the most appropriate stores for each ZIP code.
Step 4: Use appropriate sales forecasting methods for each zip code. This is done using demographic and economic data for a given locality. Regression, demand forecasting and clustering techniques can be used effectively to:
- Understand the latent factors that drive sales.
- Forecasting 12/24-month sales, also capturing the effect of cannibalization
- Forecast demand at product/segment level
- Generate similarity scores for store locations
Step 5: Consists of optimization to identify locations that can maximize profits by searching through various combinations of outlet locations, taking into account important factors such as available store budget and market potential in that specific location.
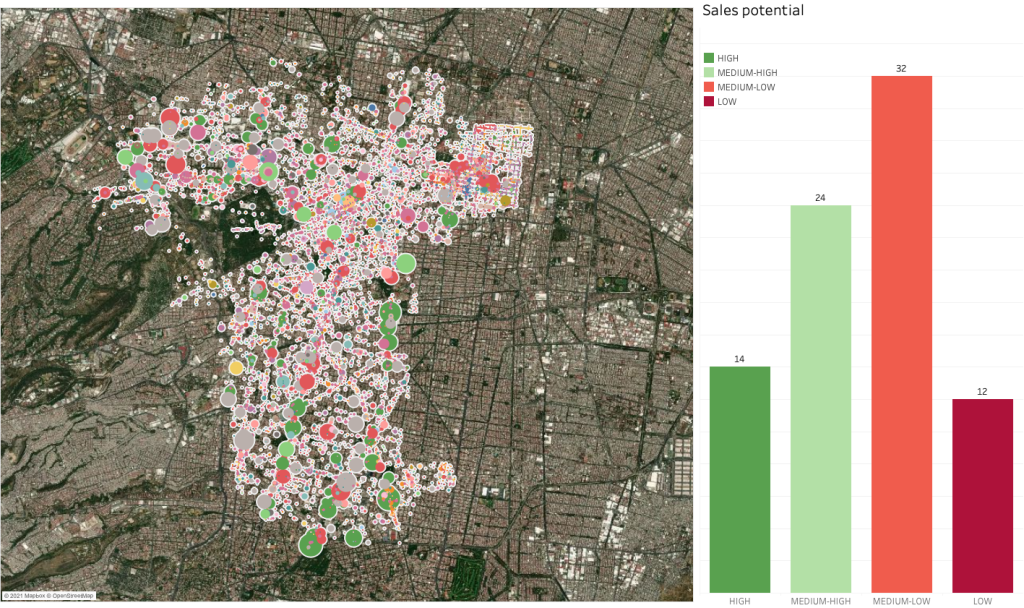
The optimizer performs the following functions to arrive at an ideal solution:
- Iterate through likely store locations at the zip code level.
- Minimize sales cannibalization using an underlying regression model
- Identify the most profitable zip codes
Also Read: “Footfall analytics for site selection strategies“
Step Six: Regression models are built to forecast existing store sales at a more granular level. This will allow for better planning by providing week/month level forecasts for new locations.
Visualize your assets with PREDIK Data-Driven in relation to those of the competition, making sure to identify new trends and opportunities before others.
