The current global crisis in supply chains is forcing companies to manage their distribution methods by adopting a proactive approach based on Big Data and advanced analytics.
The supply chain crisis has resulted in restaurant chains and fast food outlets running out of key ingredients (e.g. Nandos, McDonald’s, KFC, and Greggs), shortages on supermarket shelves (e.g. ASDA, Sainsbury’s and Morrisons), disruptions to retailers‘ product lines (e.g. IKEA) and fuel shortages.
Companies should view this crisis as an opportunity to justify the priority of adopting digital transformation within their supply chain processes using Big Data, location intelligence, mobility analytics, machine learning models, and predictive models, in order to optimize their means of distribution and successfully gauge the impact a shortage will have on operations.
You may be interested in: “Global supply chain crisis?”
Using real-time location intelligence and mapping of manufacturing and logistics centers to model responses and obtain more accurate supply arrival times, businesses can save time by proactively anticipating and identifying problems deep in the supply chain, and leveraging recommendations based on machine learning models to find alternative sources of supply.
Here are some of the solutions these technology tools provide to improve supply chain processes:
Inventory visibility: Enables you to better model and predict demand and adjust your inventory from procurement to transportation to warehouse to direct supplies to locations ahead of demand.
Supply forecasting: Helps operators predict the arrival time of supplies, enabling them to take pre-emptive action to mitigate the impact of shortages.
Adaptation: Enable companies to flexibly adapt to different scenarios and better prepare for factors that may affect their ability to ship and receive materials.
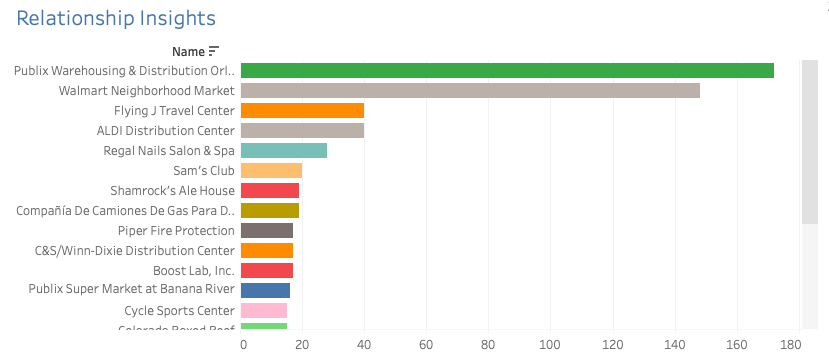
Demand modeling: Helps logistics managers have better visibility into different areas of the supply chain and improve maneuverability when problems occur.
Also read: “Spatial data to optimize supply chains”
Location analytics can be used to stimulate demand and can be enriched with data streams related to events (such as port closures and labor shortages) or weather, providing information to predict and test future demand scenarios.
Route optimization: Enable finding the best routes and determining the sequence in which each vehicle should deliver assigned orders, using custom-designed algorithms to find the shortest and most efficient path that allows drivers to visit a number of locations only once.
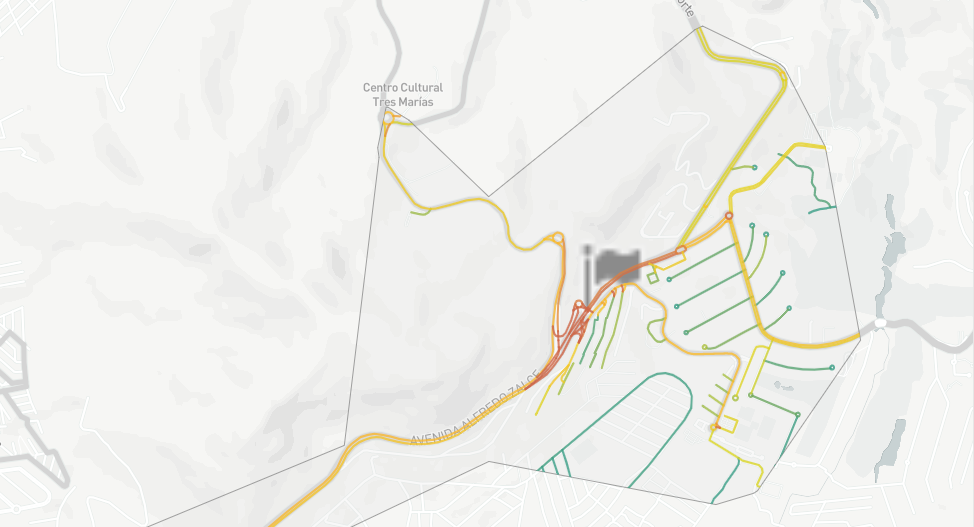
Last-mile logistics: provide information on existing constraints, inefficient allocations, and much more, solving the transportation problem, showing pickup and delivery locations, optimal routes calculated for each order, etc.
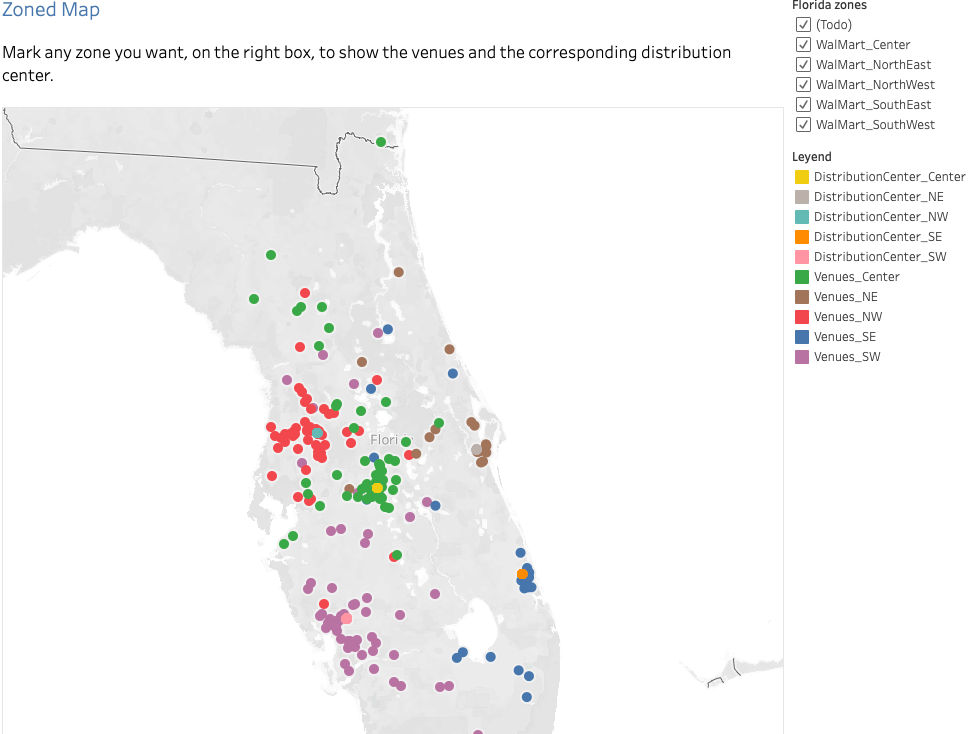
Pickup and delivery site selection: The use of location intelligence allows supply chain companies to predict demand using new data streams (such as human mobility or e-commerce propensity), as well as understand catchment areas.
Fleet Management: grants the ability to visualize existing fleets and optimize their activity over their lifetime is becoming increasingly important, with data streams such as traffic, time, and route data enabling improved efficiency and reduced costs.
Today, the industry knows the way forward, with more and more companies embarking on the search for a production analytics solution that fits their needs – after all, the only constant now is change.
At PREDIK Data-Driven we help our clients with delivery route planning, optimizing their movement, improving their estimated time of arrivals, both to reach distributor outlets, reach the consumer on time, improve omnichannel strategies, and better serve their entire customer base.
[button button_text=”Like what you see? Request a free DEMO” button_style=”style-1″ button_arrow=”true” button_rounded=”true” font=”Default” button_size=”medium” font_size=”” button_icon=”” button_align=”center” padding_v=”” padding_h=”” button_link=”/request_demo/” link_open=”_self” href_title=”” id=”” class=”” bg_color=”” text_color=”” border_size=”” border_color=”” border_radius=”” h_bg_color=”” h_text_color=”” h_border_size=”” h_border_color=”” h_border_radius=”” margin_top=”” margin_bottom=”” margin_left=”” margin_right=””]
