Learn how a retail clothing franchise used a predictive model to optimize its expansion strategy and identify the most suitable areas for the opening of new brick-and-mortar stores.
Foot traffic analytics combined with predictive models allow retail businesses to analyze different potential areas for the new stores and predict the behavior of their customers inside and outside their stores, in order to identify the ideal location for future site selection plans.
At PREDIK Data-Driven we help businesses optimize their expansion strategies with methodologies 100% based on foot traffic analytics and predictive modeling. One of our clients, an apparel retail corporation, was able to determine the ideal areas for its new stores, reducing investment risks by estimating the sales potential of the new stores, having identified its potential customers thanks to the footfall patterns and preferences of the population.
Business problem
As part of its site selection strategy, the company, dedicated to the commercialization of clothing articles, needed to identify the most suitable zones and the most profitable locations for the opening and management of new points of sale in the north of Mexico.
How did we solve it?
We implemented one of our predictive models for site selection plans, which consists of a probabilistic model that gathers geographic, demographic and subjective information on the preferences and interests of the population. Subsequently, the mobility patterns of the area of interest are analyzed, where the sales potential of each area is estimated and the possible points of sale with the highest expected profitability for the company are identified.
Methodology and data sources used for the solution
The methodology used for the development of this solution consisted of the collection, cleansing, homologation, validation and analysis of all information from secondary and tertiary sources, including, but not limited to:
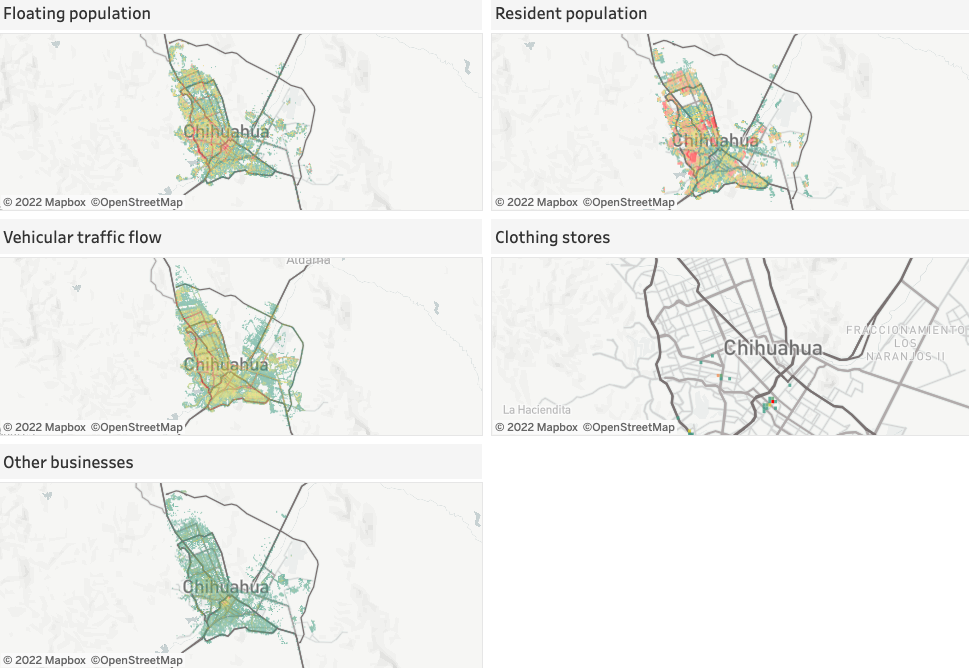
Transient/floating population characteristics
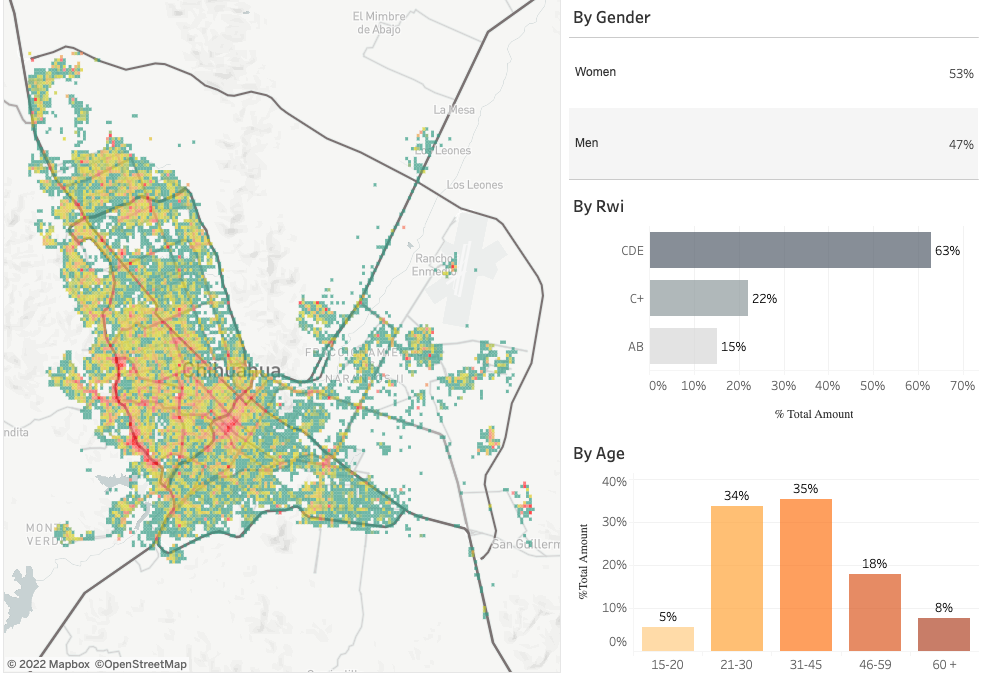
We created a heat map, where we identified the concentrations of foot traffic in the area of interest, and by adding a layer of information social network people behavior, we were able to categorize the transient population by age, gender and purchasing power.
Resident population characteristics
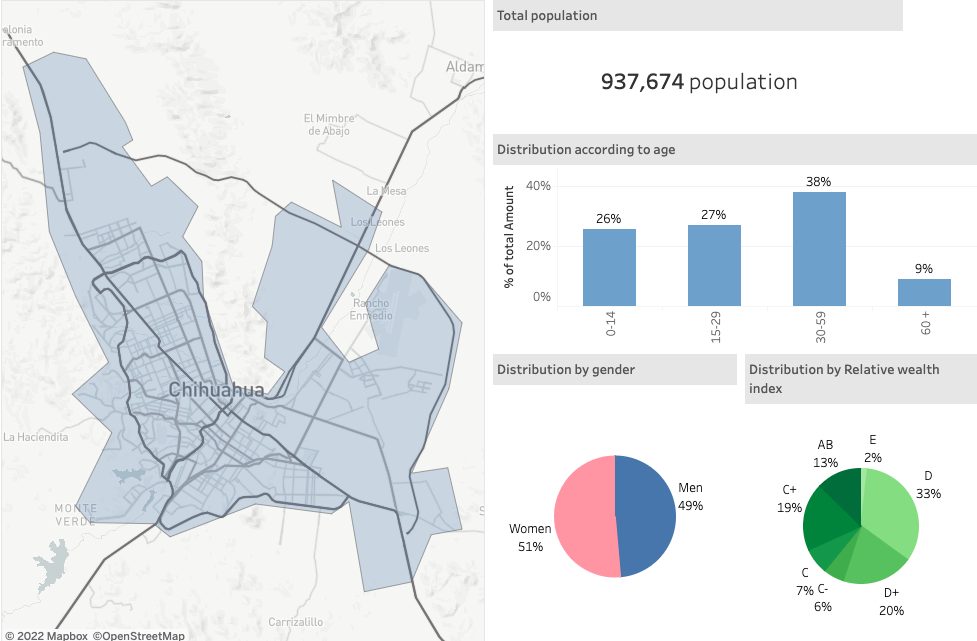
Using advanced Big Data techniques, we also classified the resident population, which gave us, in the end, an overview of the potential customers in the State under analysis.
Average population expenditure on clothing
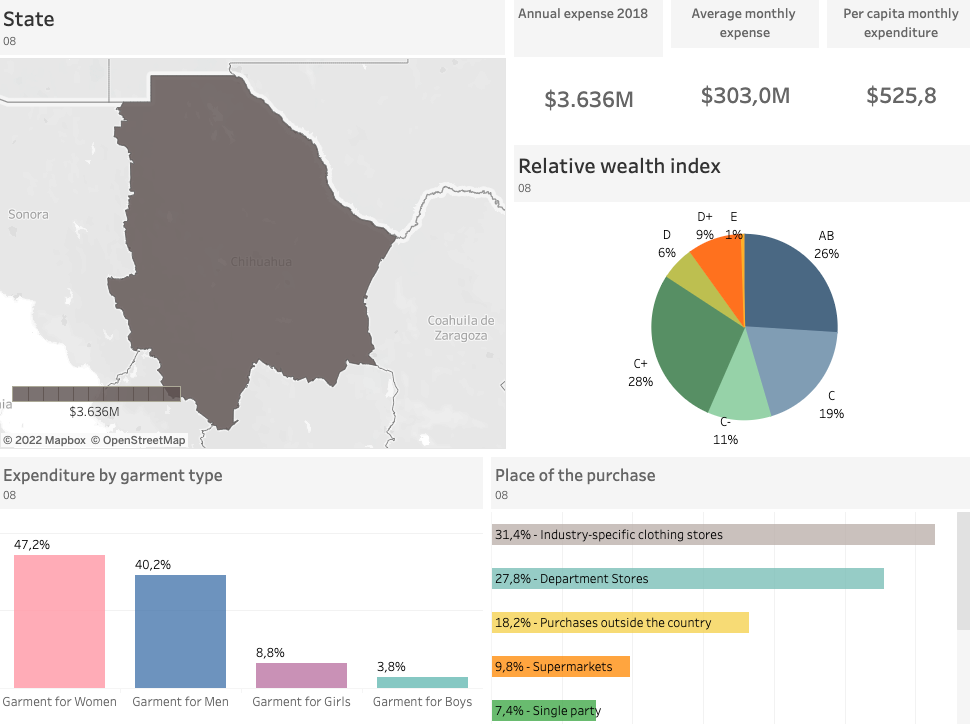
Using several other data layers (which vary depending on the country in focus), we estimated the average annual, monthly and per capita expenditures of the population related to clothing articles. This level of detail allowed us to identify which types of apparel are most commonly purchased and from where it were acquired.
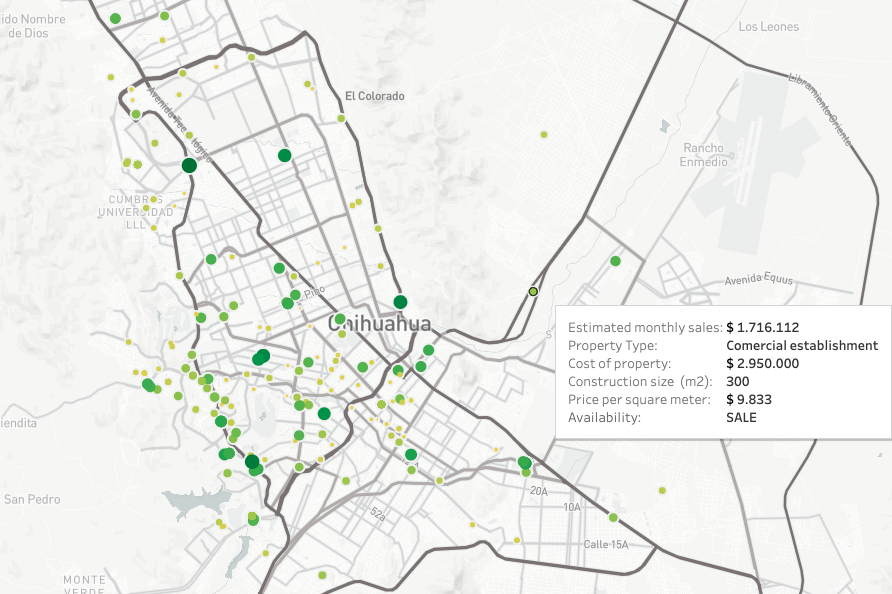
Analysis of the properties available for rent and sale in the area of interest
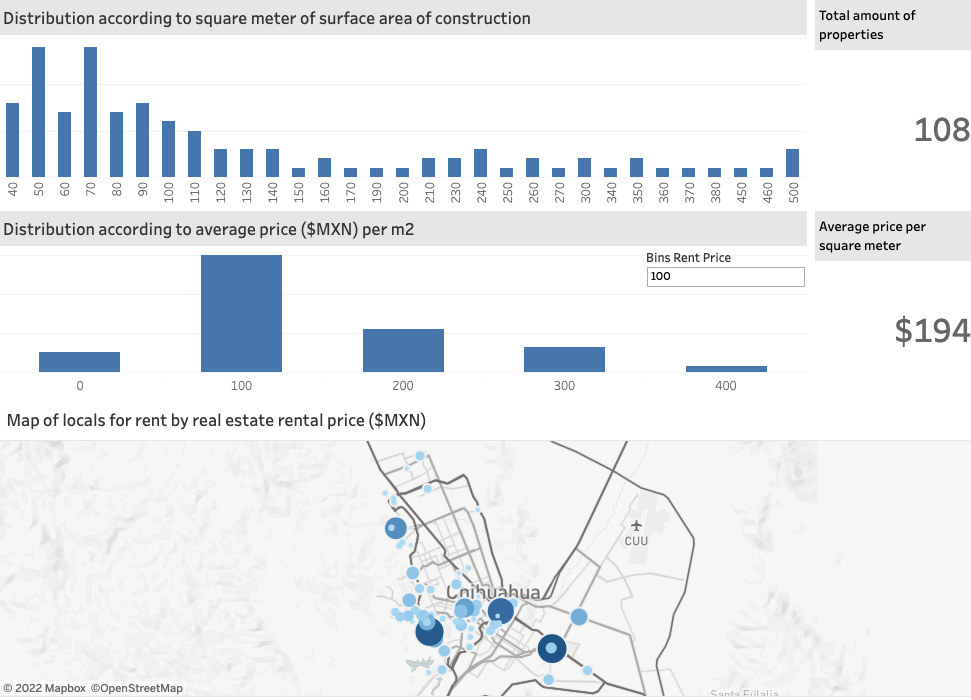
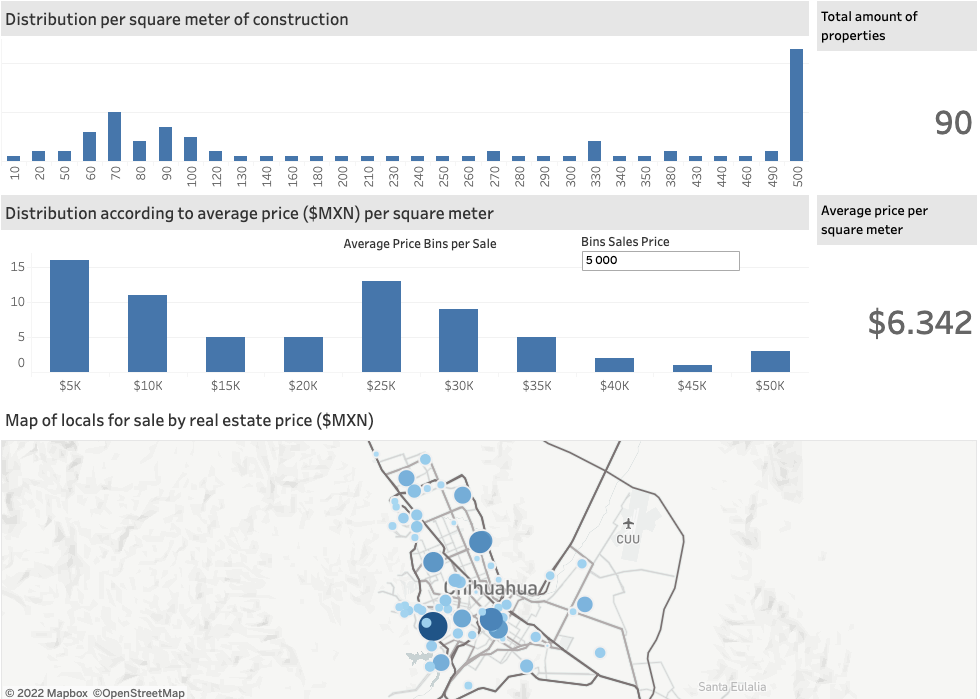
To identify the ideal areas for new points of sale openings, we used data from real estate information platforms operating in the country, and through an analysis, we segmented the properties by construction area and average price per square meter, which allowed us to distinguish the price of the available properties according to their sale and rental price.
Vehicular traffic in the area of interest
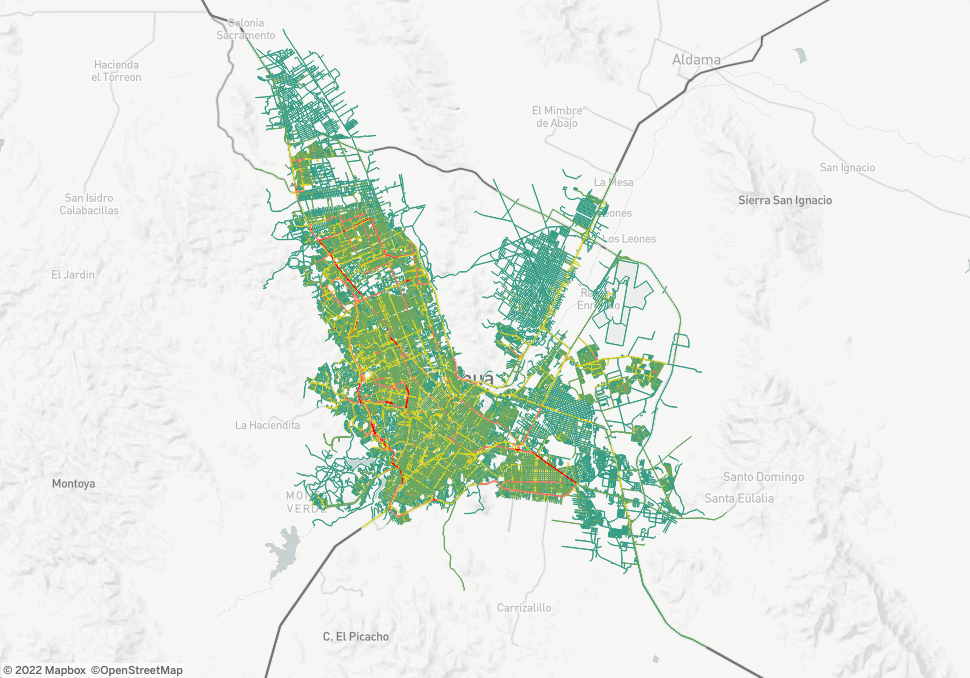
We also generated a map showing the vehicular traffic flows within the areas of affluence of the points of interest. The vehicular flow corresponds to the annual average daily traffic. The red color denotes a higher concentration of traffic, while the green color shows the streets with less affluence. This helps to identify the busiest places, as well as the busiest times of the day.
Analysis of the competitors
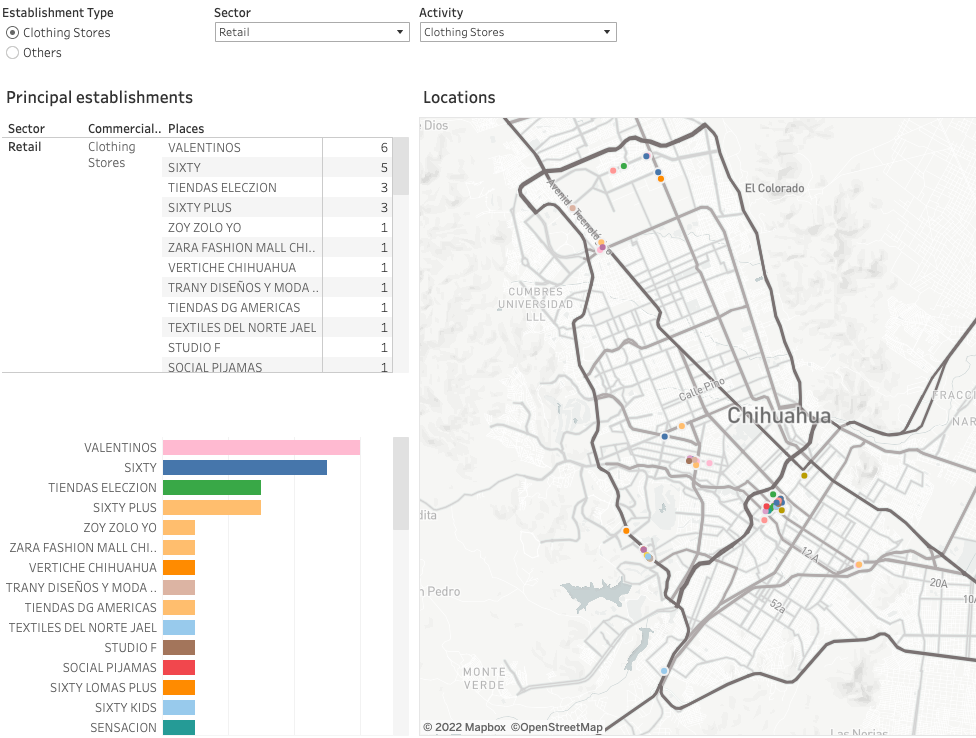
In order to cover all possible parameters for the study, we conducted a competitive analysis where we identified the location of rival clothing stores, in order to maximize the efficiency of the model. This type of analysis is also very useful to avoid brand cannibalization, which can occur if there are outlets that are very close to each other, serving the same public.
Analysis of the client’s points of sale
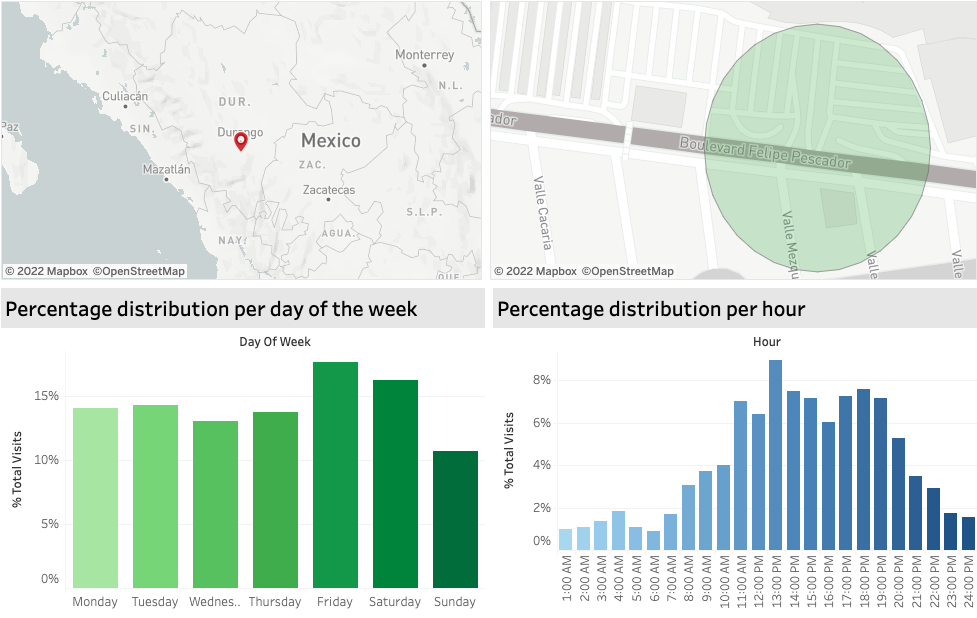
Thanks to our foot traffic analysis, we were able to learn more about the customer’s points of sale, and thus identify the mobility and consumption patterns of visitors. This type of information is used to understand the power hours of the stores, the evolution of visits, the most and least visited days, or even to understand which customers are shared with the competition. All these variables were used to generate the final step and train our prediction model.
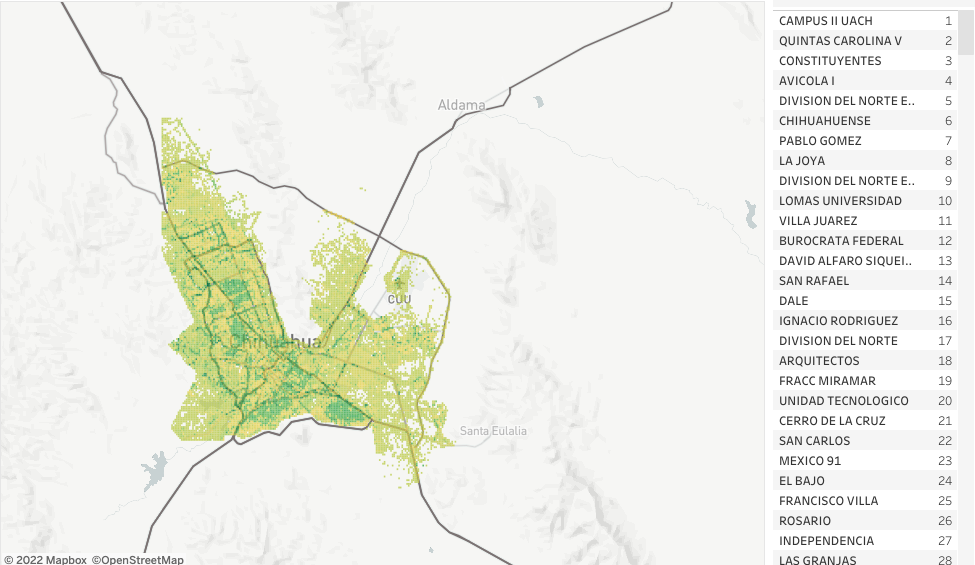
Final Results
The following graph shows the result of the sales estimation model for each quadrant according to its characteristics. The result shown corresponds to the expected monthly sales. The size of the quadrants is 150m x 150m and the dark green color means higher expected sales while the light green color means lower expected sales. On the right is the ranking of the areas with the highest sales potential.
In this visualization, we observe the estimated average monthly sales of the quadrant in which the property falls, the larger and more tonal of the point shown means that this location will have a higher estimated average monthly sales, and the smaller and less tonal will mean lower estimated average monthly sales.
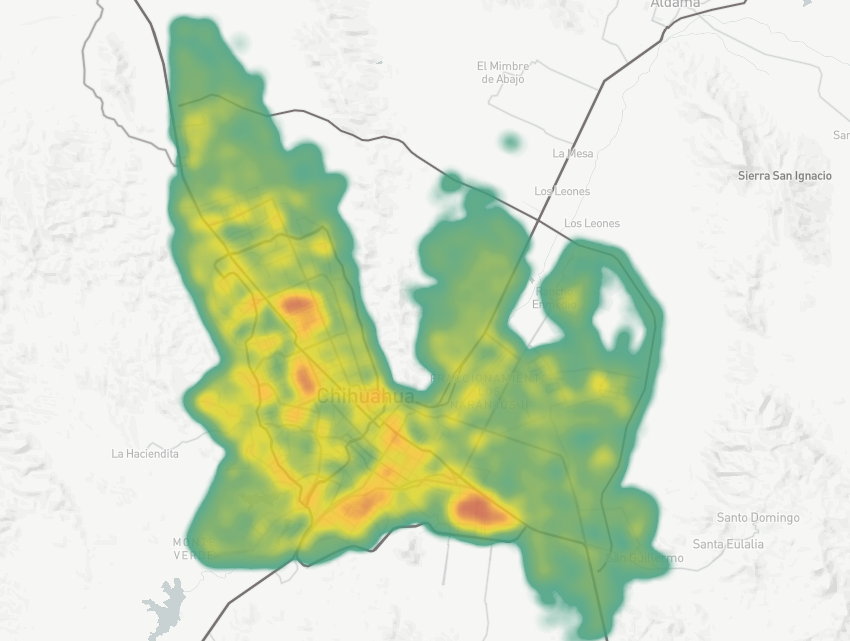
These visualizations can also be recreated with heat maps that provide a more general overview of the particular area of interest.
At PREDIK Data-Driven we go beyond simple BI maps of store sales. Use our sophisticated analytical models to predict where the next big opportunity for your business could be.
