Understanding mobility and identifying points of interest help large retail office products suppliers to measure foot traffic in and out of their stores and to better comprehend the behavioral patterns of consumers.
The correlation between foot traffic, visits, sales, and the success of retail office products suppliers has been studied and proven, so the development of this type of analysis has become a priority in the site selection process and expansion modeling.
Case Study
Foot traffic analytics: OfficeMax Vs. Office DEPOT, Mexico City, Mexico
At PREDIK Data-Driven we conducted a detailed study of two retail franchises merged in 2013 that provide office supplies in Mexico city: OfficeMax and Office DEPOT.
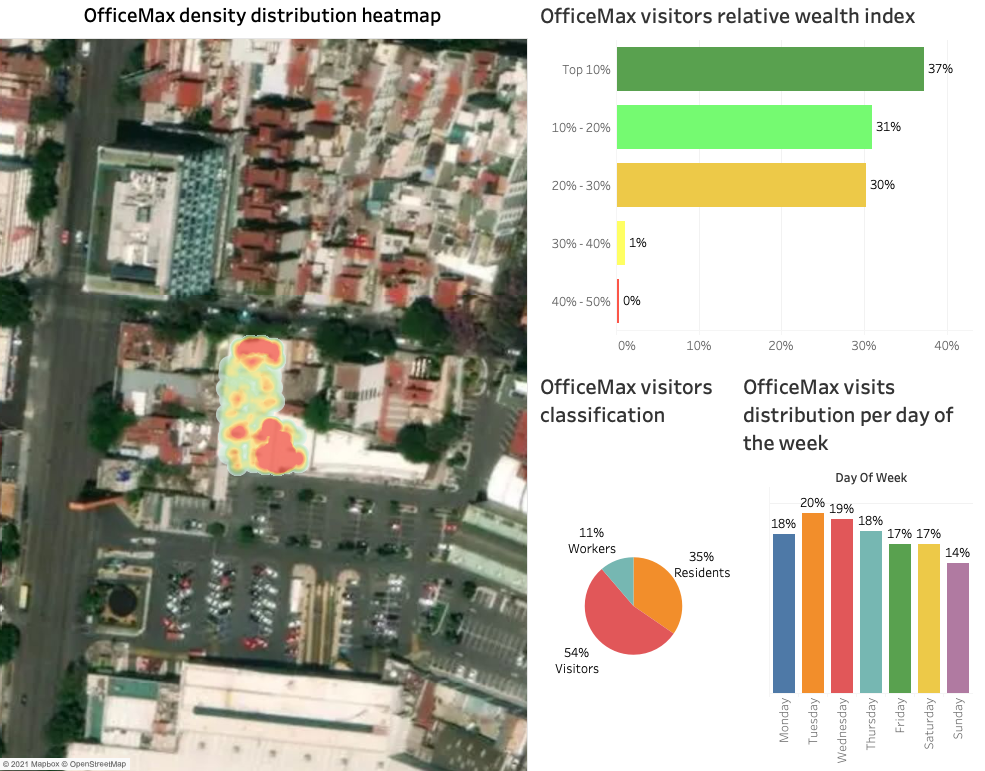
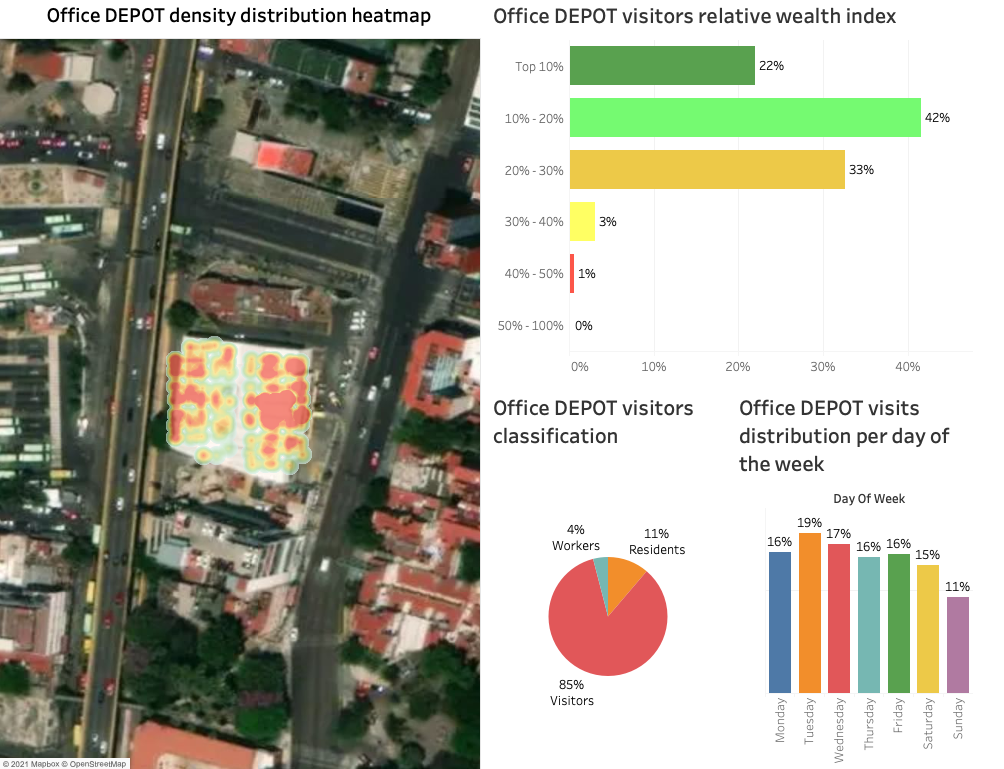
How are visits distributed in each establishment?
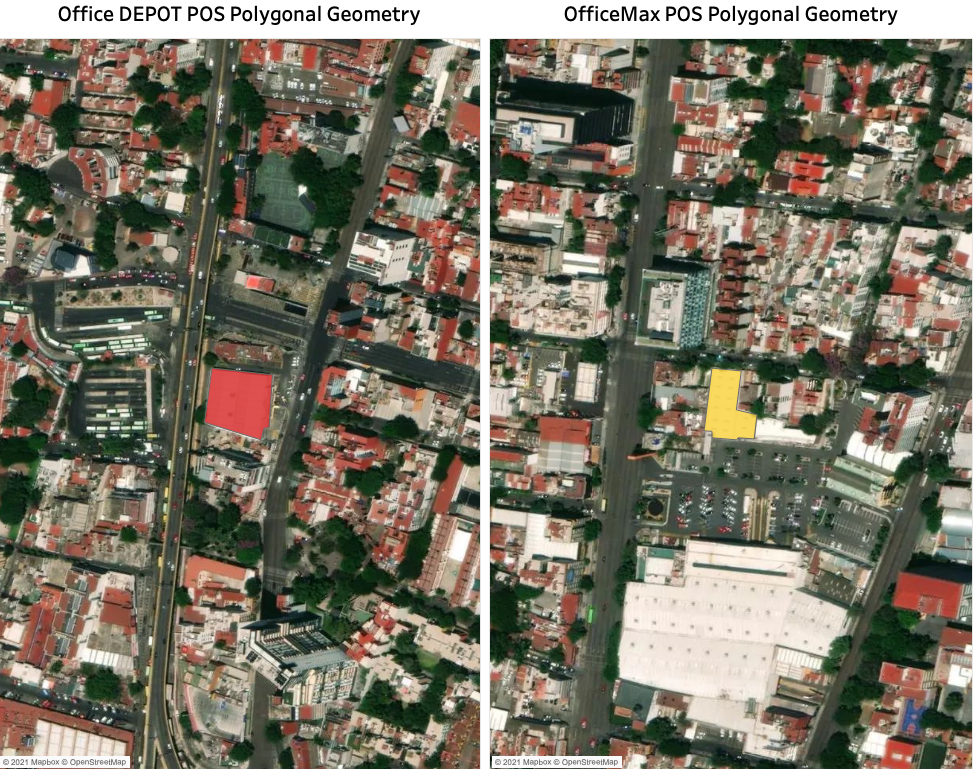
Through location analytics, we identify the points of interest and apply a heat map to visualize the in-store mobility patterns of the clients, which allows us to visualize the customer journey, the dispersion of consumers, and the distribution of visits within both establishments.
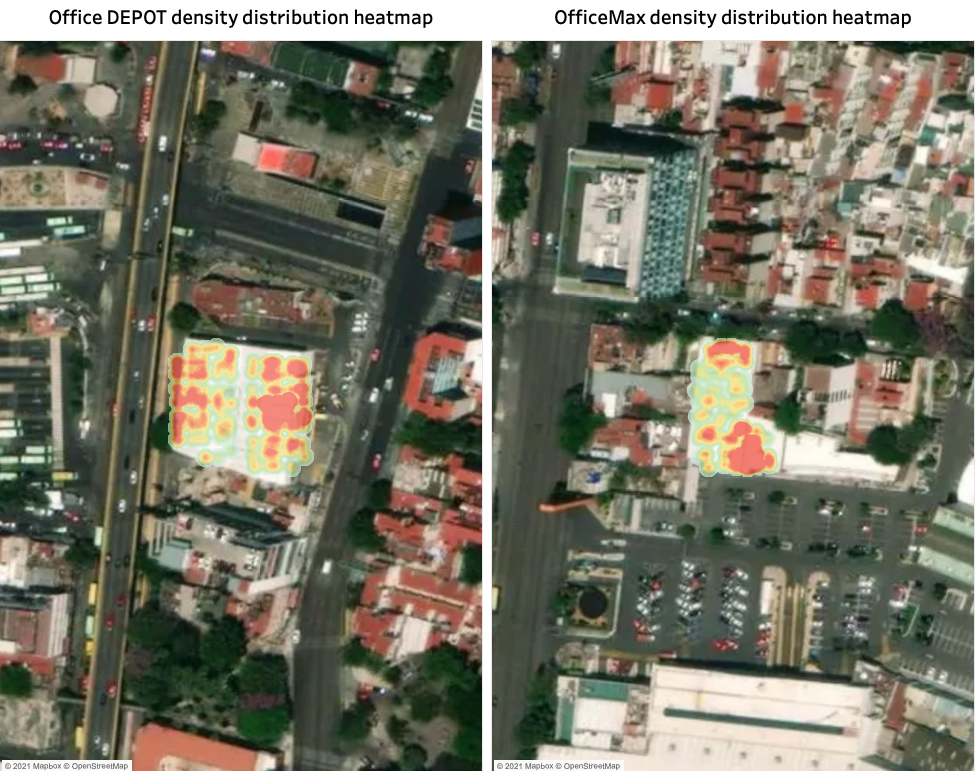
This provides very useful information when conceptualizing the design of the infrastructure and internal architectural plans that make up each establishment so that leaders can implement strategies that improve the customer journey and implement more efficient expansion models while maximizing the shopping experience of consumers.
Which of the stores is the most visited?
Percentage distribution of visits recorded in December 2020:
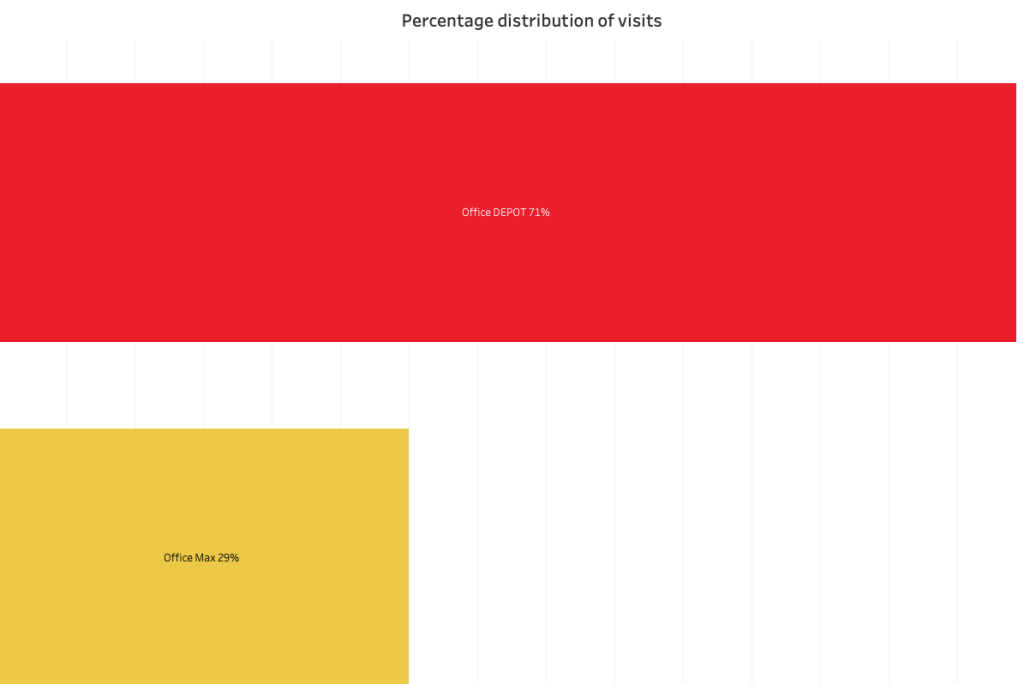
By analyzing in-store mobility using the stated time period, we identified that 71% chose to visit Office DEPOT, while the remaining 16% preferred OfficeMax, which correlates with store location and consumer preference when it comes to choosing office supplies products.
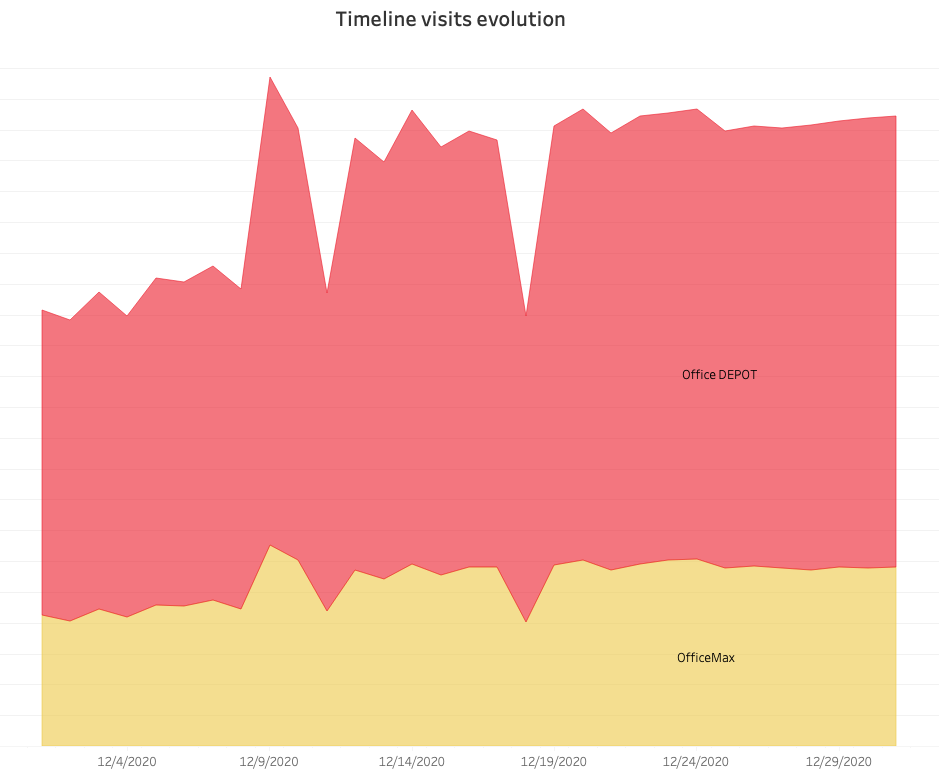
These analyses allow businesses to observe the evolution of visits over time, which can be very useful to identify patterns of foot traffic customer behavior and market trends in high and low traffic seasons.
Identify consumer behavior: Which days of the week are the most visited?
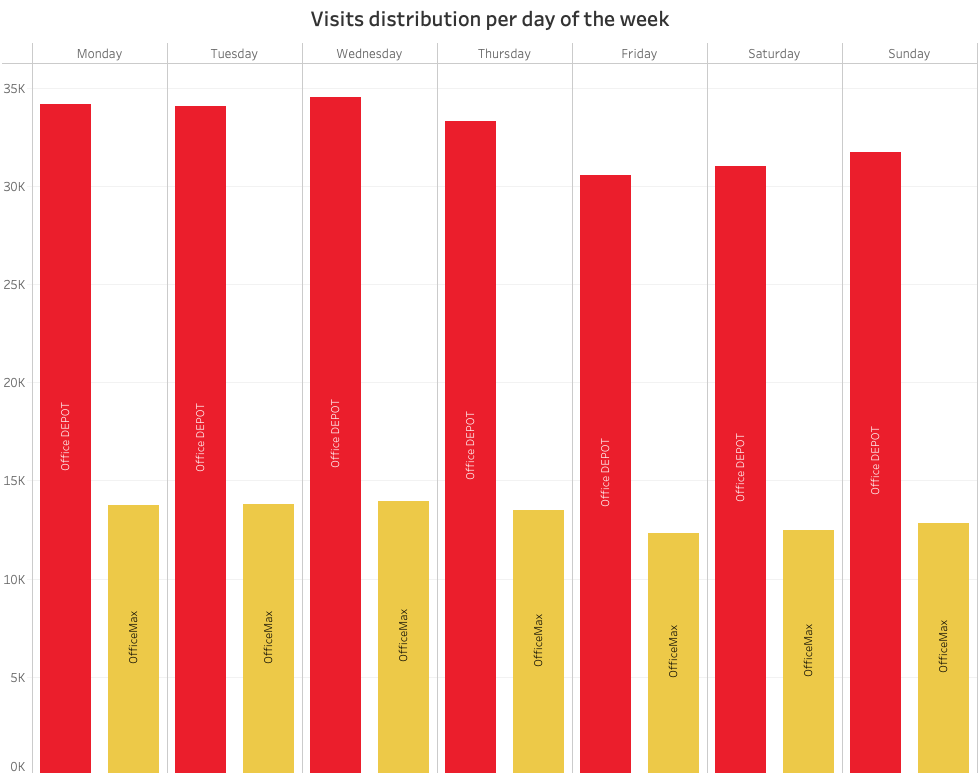
One of the most interesting applications of location intelligence is that it allows gaining detailed knowledge of customers’ behavior patterns by day, hour, month, or year, offering valuable insights to design marketing campaigns and commercial strategies based on the power hours of the stores.
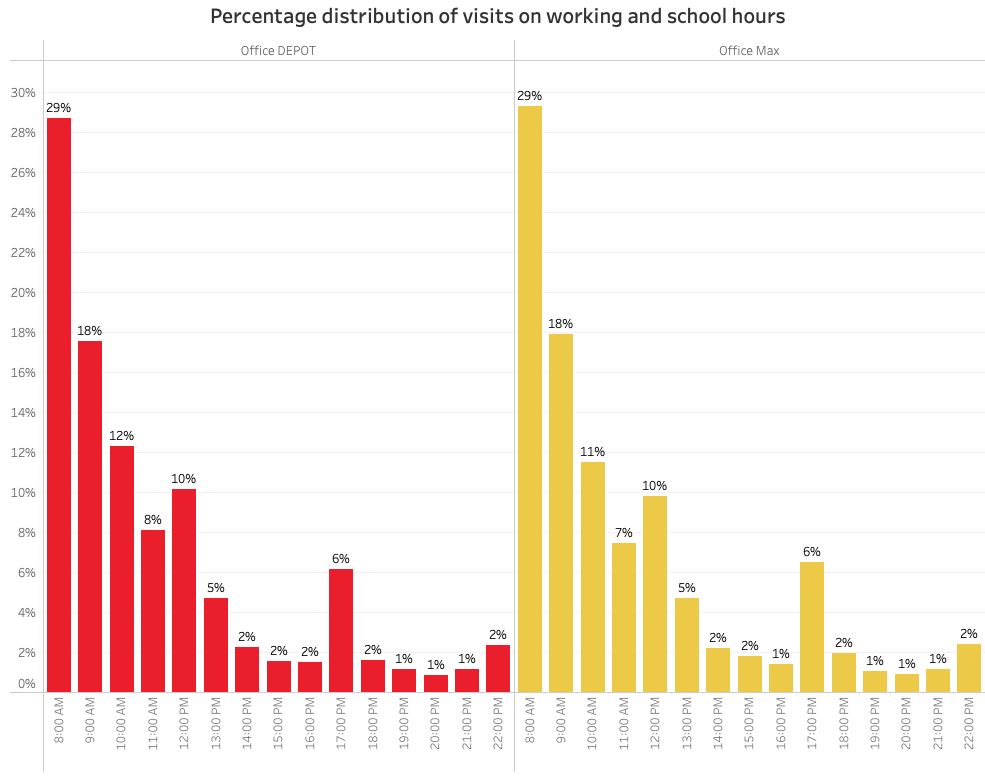
This analysis is very useful to know what is the performance of the stores at peak and off-peak hours of the day.
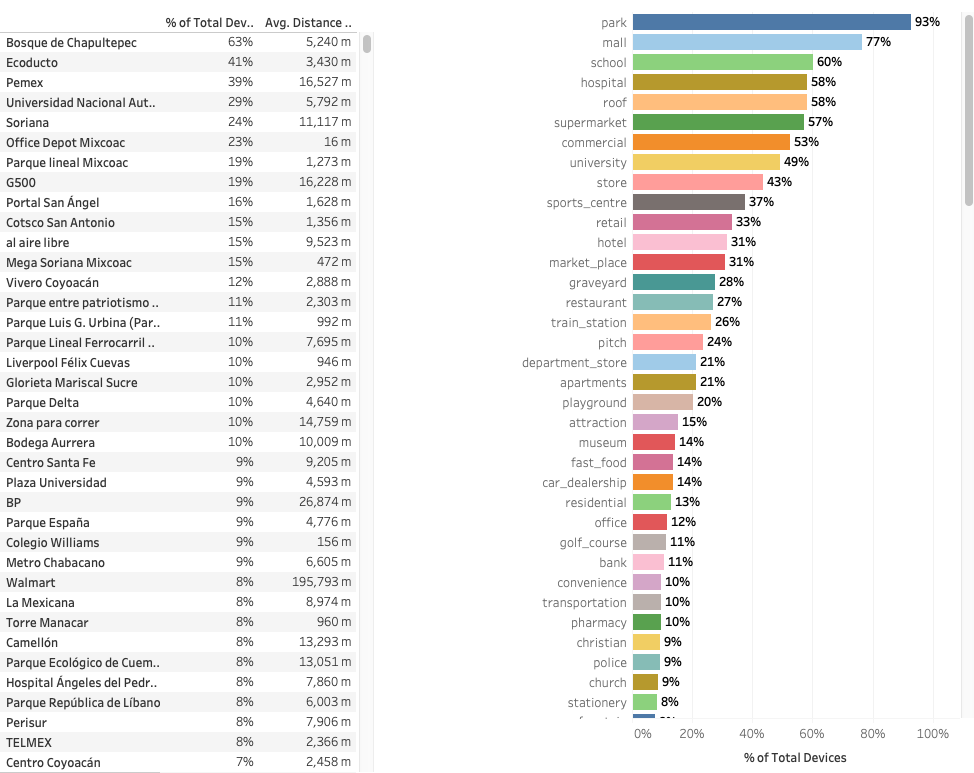
What is the foot traffic mobility pattern around both stores?
Although foot traffic is related to the performance of any retail location, it is not the only key factor for success. Another fundamental aspect to be analyzed is the environment of the outlets, as it allows for comparisons and estimates of the number of visits, revenues, strategic and operational movements of the competition.
By gathering information on the competition’s potential customers, it is possible to carry out a more detailed benchmarking and generate strategies to capture the competition’s clients.
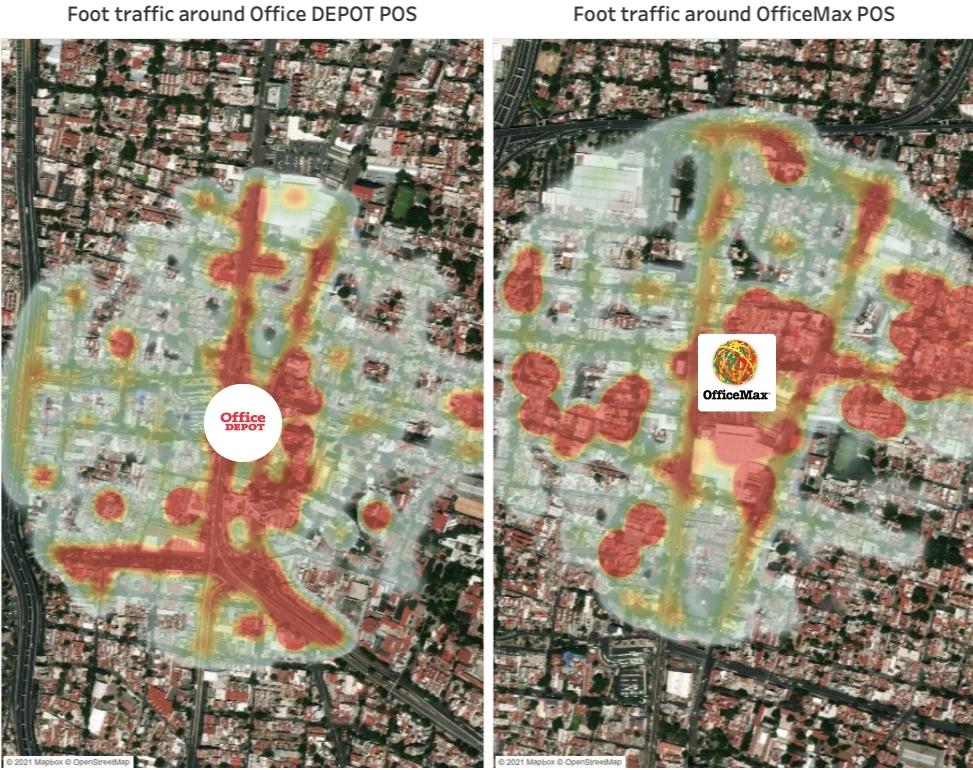
This analysis of the environment provides us with a detailed picture of the surrounding areas and the mobility patterns of people moving through the area. This data, combined with other factors, provides deep insight into predicting the revenues of any retail establishment.
What other insights can be gained by analyzing footfall at the outlets?
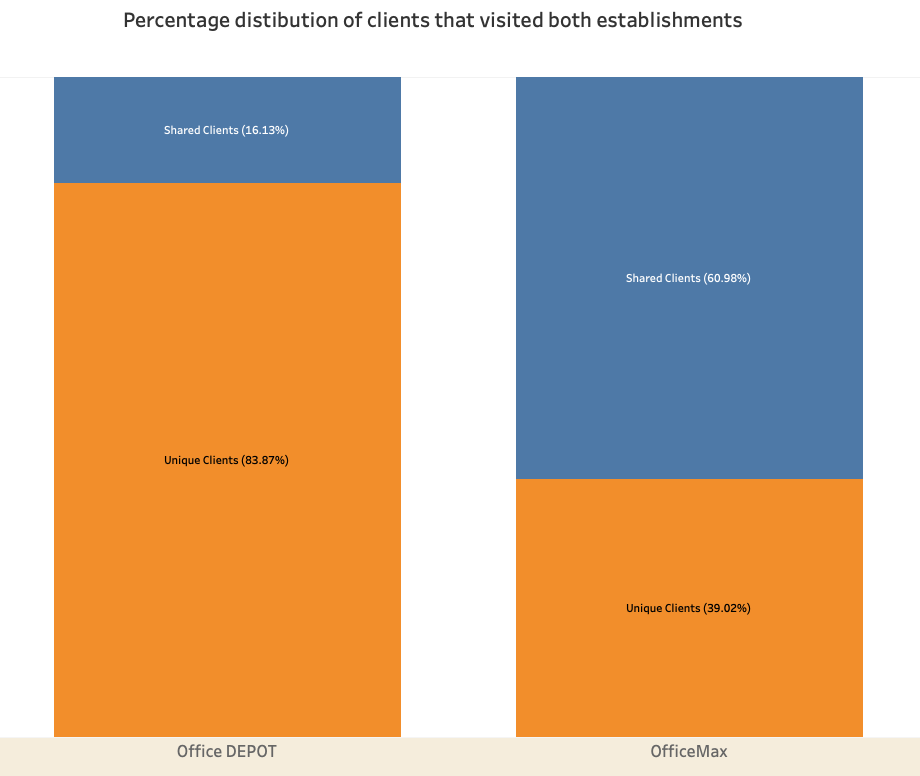
Understand which customers visited both stores
By analyzing data over a given period of time at a specific location, it is possible to estimate the percentage distribution of consumers who visited both stores.
These solutions benefit any type of business, an example of this is another case study that was conducted to compare two of the most popular hardware stores in the city of Dallas, Texas, USA, the findings were more than interesting. Read more about this case: “Competitor Analytics: Home Depot Vs. Lowe’s home improvement“
Customer Analytics
With this analysis, it’s possible to infer in which other places (stores, restaurants, shopping malls, residential areas, among others) the people who were at a point of interest also visited. Thus, Office DEPOT and OfficeMax can analyze how their customers behave, since they can look where and how long they were before and after visiting the stores. This allows them to generate high-value insights to optimize the understanding of current consumers and search for new potential customers with similar behaviors.
Identifying ideal areas in expansion and site selection strategies
With mobility data, it’s possible to clearly understand the behavior of the people who pass through a given area, how they’re alike, their tastes, preferences, relative wealth index, and purchasing potential. Including an in-depth analysis of the commercial establishments in the area in question, becomes a crucial factor in determining the best locations for the opening of new stores.
What is the revenue potential of my competitor?
Through machine learning models, it’s possible to predict the revenue and visits of a competitors´ store. In case Office DEPOT and OfficeMax were competitors, these models, could help both franchises to estimate their revenue in a specific week, month, or year. These models can also be used, for instance, to predict the potential success of an outlet that is about to open. This is ideal to complement feasibility studies for new stores in expansion plans.
All these insights are generated by applying location intelligence and mobility analysis, if you are interested in knowing more about these insights, we conducted a POI characterization case study in Bangalore, India POI Analytics: Uses and Applications.
