Pharmaceutical companies need to apply location intelligence techniques and foot traffic analytics to identify consumer mobility patterns, in order to maximize sales and generate more efficient expansion models.
Foot traffic analytics and location intelligence are two powerful tools. They provide valuable insights into people’s movements, behaviors, and preferences in specific geographical areas.
What is foot traffic analytics
Footfall analytics, also known as foot traffic analytics, involves collecting, processing, and analyzing real-time location data related to the number of people visiting a particular place—for example, a retail store, shopping mall, or public space.
This footfall data can come from different methods. Sources of data collection include:
- Wi-Fi signals.
- GPS tracking.
- Traffic counters.
- People counters.
- Social media apps.
- Video surveillance.
- Mobile device tracking.
Our reading recommendation: What is foot traffic data and how to obtain it?
Why is it so crucial to analyze foot traffic data?
Through this information, businesses can gain a detailed picture of their location performance while predicting or estimating:
- Brand positioning
- Best marketing campaigns to increase foot traffic
- Customer behavior
- Market trends
- Competitors revenue
- Expansion models (site selection)
Also, measuring foot traffic through spatial data mining, it is possible to collect valuable information such as:
- Quantity and classification of people visiting an establishment or area of interest.
- Most visited times and days.
- Visit volume changes year over year.
- Foot traffic trends and real estate.
- Conversion rates.
- Dwell time.
- Visitation counts in-store and out-store.
- Market potential of POS and POIs.
The Synergy of Foot Traffic Analytics & Location Intelligence
Foot traffic store analytics and location intelligence provide businesses and organizations with powerful insights. These can help them optimize their operations, boost their marketing efforts, and make data-driven decisions about their physical stores.
By understanding people’s movement and preferences within specific locations and using this information to inform business decisions, companies can gain a competitive edge and drive growth in today’s fast-paced, ever-evolving marketplace.
Customer Analytics
Through footfall analytics, businesses can analyze which other places the customer visited besides. Did they go to another retail store? A restaurant? A shopping mall? Back to their homes? Or maybe they ended up visiting the competition.
We will explore the differences between traffic counts of Walgreens and CVS retail pharmacies in this use case.
We also recommend yo reading: Consumer Insights: Understand Your Customers With Big Data
Identifying ideal areas in expansion and site selection strategies
With mobility data, it’s possible to get a reliable “people counter.” Also, it is easier to understand users’ similarities regarding preferences, socioeconomic level, and purchasing potential.
An in-depth analysis of the commercial establishments in a specific area can determine the best locations for opening new retail stores (Or pharmacies).
What is the revenue potential of my competitor?
Through Machine Learning models, it’s possible to predict the revenue and visits of a competitor’s store.
Any business can estimate the revenue of its competitors in a specific week, month, or year using location intelligence. Data models can also be used, for instance, to predict the potential success of a store that is about to open.
All these insights result from applying location intelligence and mobility analysis.
What about Pharmacy foot traffic analytics?
By understanding more about foot traffic, you can realize that pharmacy foot traffic is a crucial metric for understanding customer behavior, preferences, and visitation patterns in a pharmacy or drugstore setting.
By analyzing foot traffic data, pharmacies can optimize their operations, tailor marketing efforts, and make strategic decisions. In fact, big drugstore chains like Rite Aid uses retail pharmacy analytics.
The correlation between foot traffic, sales, and the success of pharmacy franchises have been studied and proven, so the development of this type of analysis has become a priority in the site selection process and expansion modeling.
Foot traffic analytics: Walgreens Vs. CVS Pharmacy, Houston, Texas, USA
At PREDIK Data-Driven we conducted a detailed study of two retail pharmacies in the estate of Texas, USA: Walgreens and CVS Pharmacy, both located in Houston.
In this case study, we analyze the mobility and foot traffic inside and outside both pharmacies, in order to understand the behavioral patterns of consumers visiting both franchises. This analysis aims to answer the following questions:
- How do visitors move inside each pharmacy?
- Which pharmacy receives more visitors?
- Which days of the week are the most visited for each pharmacy?
- What is the foot traffic mobility pattern around both pharmacies?
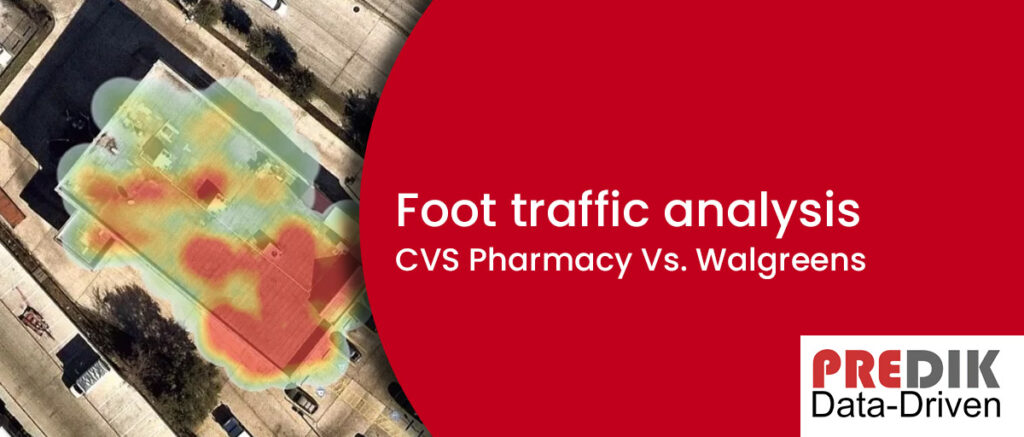
How do visitors move inside each pharmacy?
Through location analytics, we applied heat map technology to both locations. This allowed us to visualize the in-store mobility patterns of their visitors.
Heat maps help understand the customer journey, visitor dispersion, and visit distribution.
Using foot traffic data to do an in-store analysis provides valuable information when conceptualizing a site’s infrastructure design and internal architectural plans.
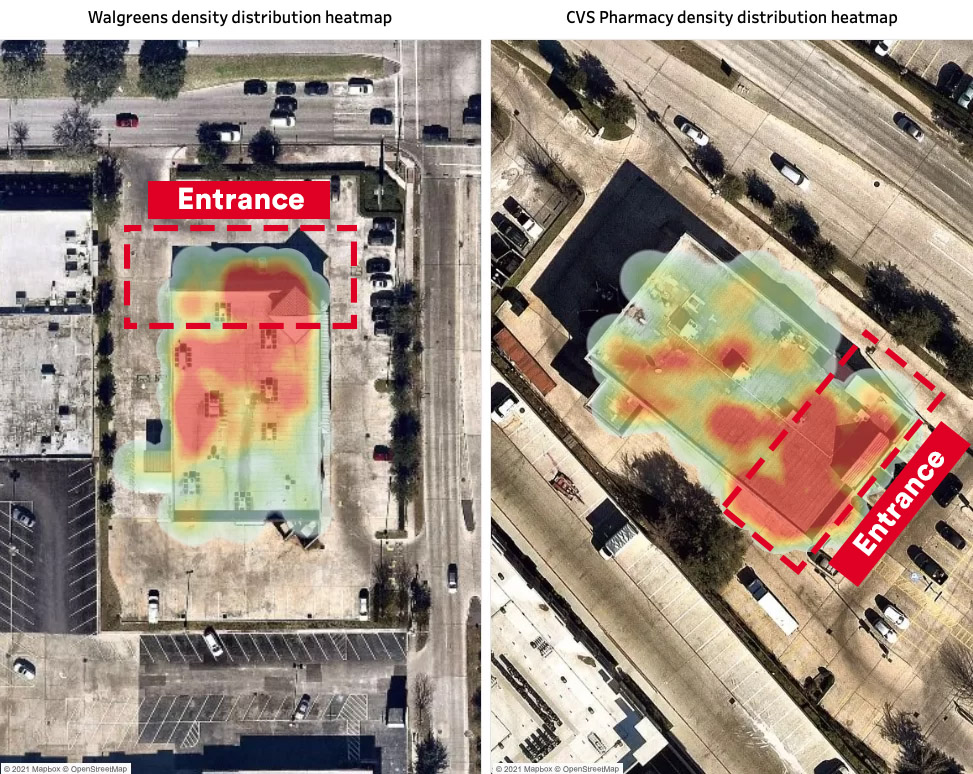
As we can see in the images, both stores have the same building distribution. Also, the heat map analysis shows that visitors walk around the areas near the entrance.
Which pharmacy receives more visitors?
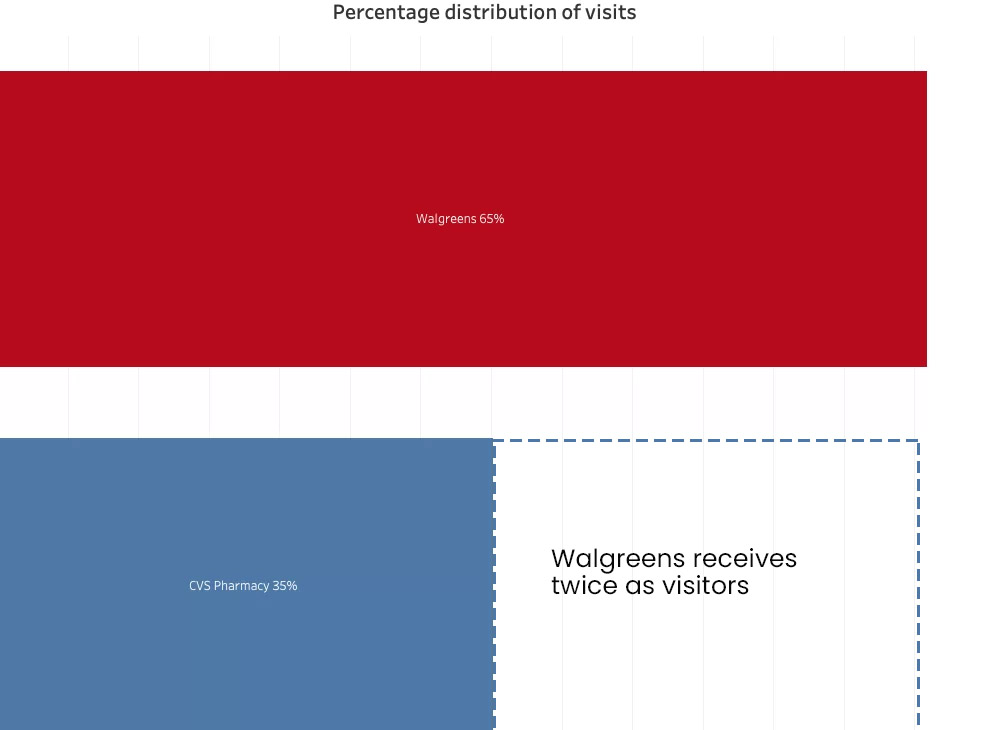
Analyzing their in-store mobility during six months, we identified that 65% chose to visit Walgreens, while the remaining 35% preferred CVS Pharmacy.
The fact that Walgreens receives twice as visitors may correlate with store location and consumer preferences. We will explore these factors further in the analysis.
These analyses allow you to observe the evolution of visits over time, which can be very useful to identify patterns of foot traffic customer behavior and market trends in high and low traffic seasons.
Which days of the week are the most visited for each pharmacy?
Location intelligence provides detailed knowledge about customers’ behavior patterns by day, hour, month, or year. This analysis offers valuable insights into designing marketing campaigns and commercial strategies based on the business power hours.
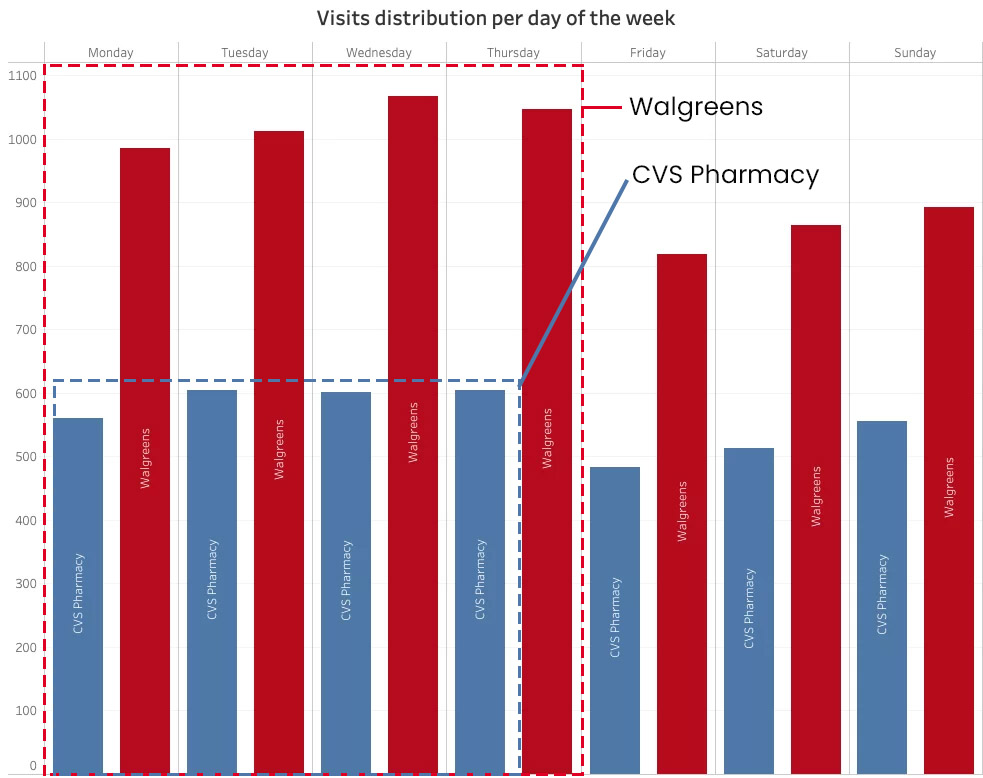
As we can see on the graph, both pharmacies show similar visit behavior throughout the week. Both locations receive more visitors on workdays.
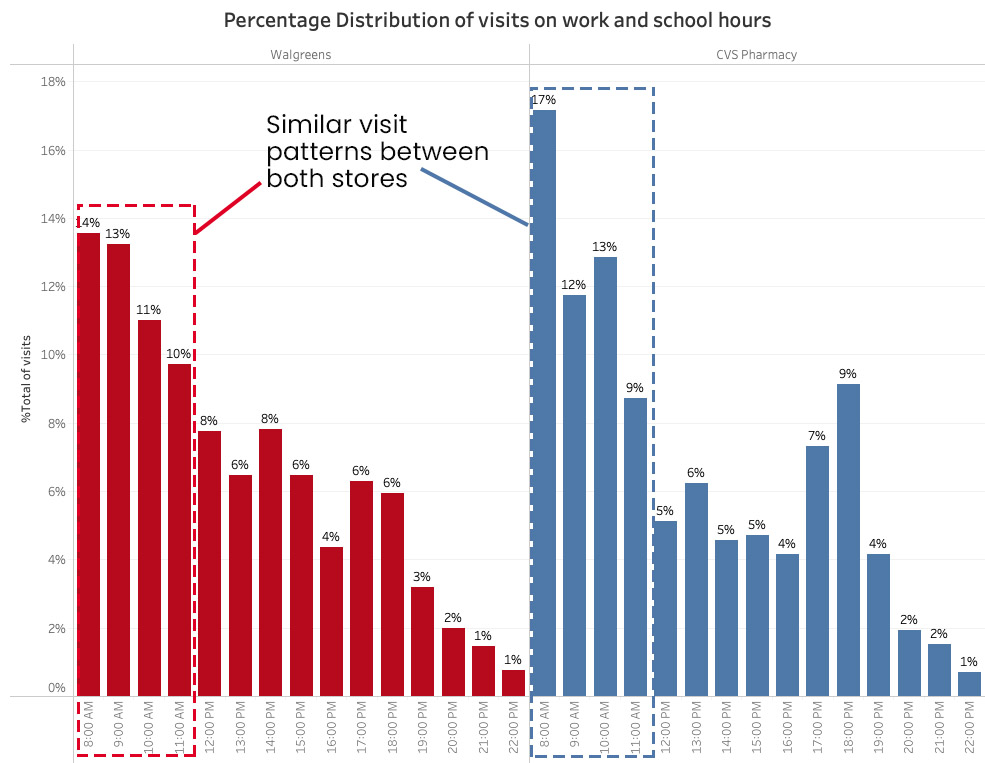
This analysis is very useful to know what is the performance of the stores at peak and off-peak hours of the day.
Both pharmacy stores receive more visitors from early in the morning until noon. Then volume increases again from 5 p.m. to 6 p.m.
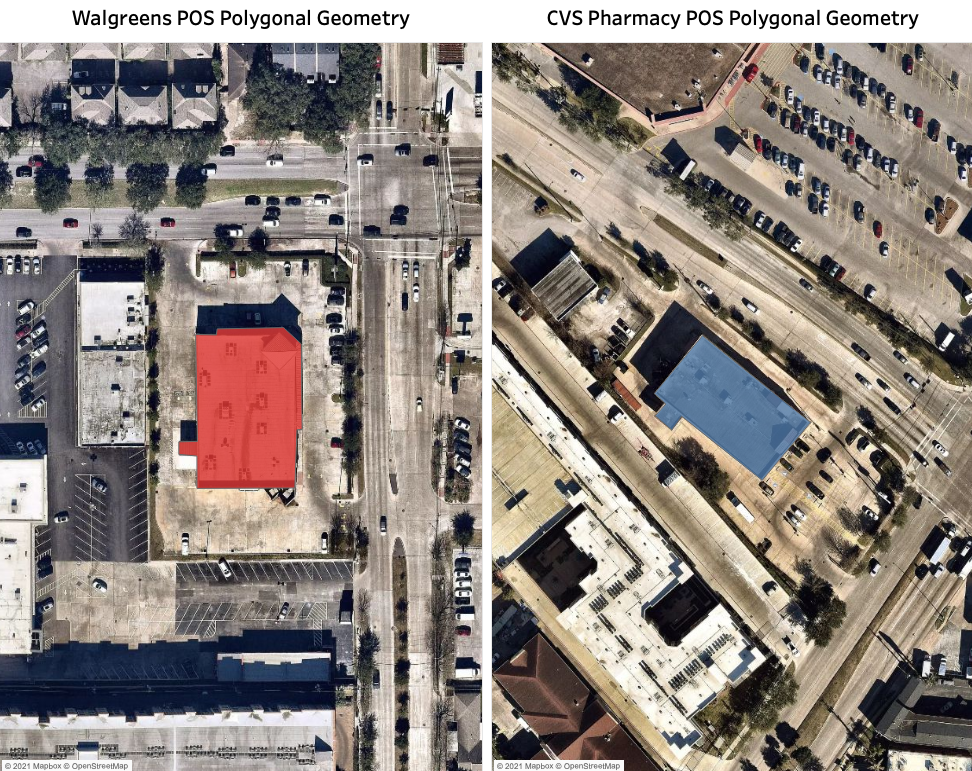
What is the foot traffic mobility pattern around both pharmacies?
Although in-store foot traffic is related to the performance of any retail location, it is just one piece of the equation. Analyzing the store’s surroundings is also fundamental, as it allows us to understand if elements like accessibility determine visit volumes.
Also, gathering information on the competitors’ performance makes it possible to carry out more detailed benchmarking.
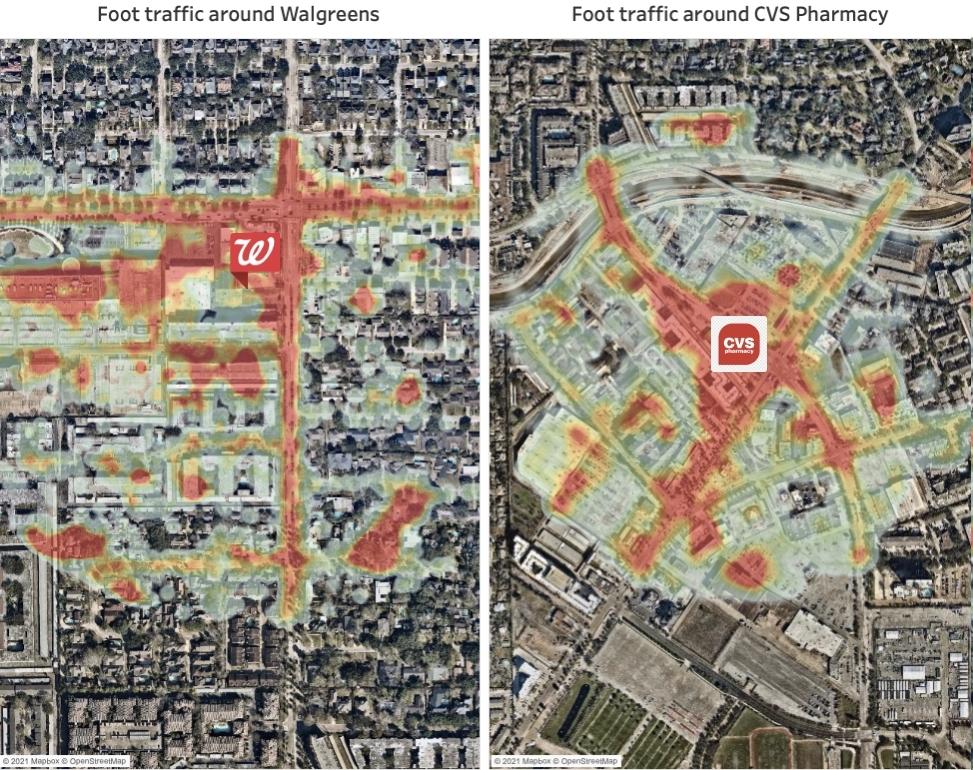
This analysis helps us understand the mobility patterns of people moving through the area. This data, combined with other factors, provides deep insight into predicting the revenues of any retail establishment.
As we can see, both stores are well-connected with high-density avenues. The heat maps show that both Walgreens and CVS are located in a convenient area (Visible to passersby and drivers).
Conclusions so far…
- Foot data analysis between Texas’ Walgreens and CVS returned the following insights:
Walgreens receives twice as visitors as CVS. Exploring the accessibility of both stores, we can infer that location is not the leading cause of this (Both pharmacies are located in a high-traffic area). - Both stores have similar visitor patterns related to visit distribution per day and hour. This tells us that Walgreens and CVS share a similar type of user (So we can also dismiss this factor as the main cause of Walgreens’ visit volume).
- Another reason Walgreens receives more visitors than CVS could be brand perception. To test this hypothesis, we need to dig more into the preferences of their visitors.
If you want to see the entire case study, contact us.
Get the best out of foot traffic data
At PREDIK Data-Driven, we are experts in foot traffic analysis. Through our Big Data specialized methodology, our team of experts enriches it with alternative data.
The result? You get a solution based on accurate information that can maximize your stores’ profitability and results.