Through geospatial data analysis techniques, PREDIK Data-Driven carried out an analysis of five Walmart distribution centers in Florida, United States, with the aim of identifying patterns in the supply chains of these five centers and their relationships with commercial establishments and other logistics complexes in the State.
Through this analysis, whose objective is to show how geospatial data science techniques can be applied to solve problems in the logistics sector, the existing relationships between Walmartdistribution centers and their supply sites were identified and characterized, so that different large commercial chains can evaluate and at the same time improve processes in their respective supply chains.
How was it done?
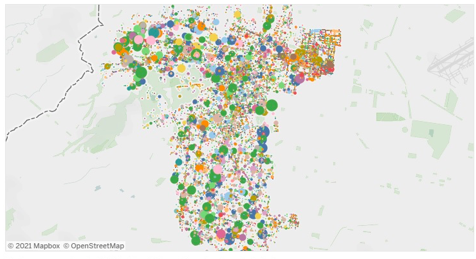
Hundreds of thousands of mobile device records in the areas where Walmart distribution centers are located were analyzed. This cellular positioning data, which is obtained for a specific location and time period, when analyzed on a large scale, provides insight into the influx of people at each point of interest, in this case, the distribution centers and other commercial establishments in the area in question.
With this information, it was possible to infer patterns of behavior in the logistics chain between the distribution centers and the locations to be supplied, establishing the delivery and reception parties with a count of mutual visits. This made it possible to pinpoint the main and most important relationships between distribution centers and stores.
You might be interested in: “Big Data and Business: Answers to Unknown Questions“
Methodology
In order to predict and understand the visits and relationships between Walmart’s distribution centers in the state of Florida and the surrounding establishments, the following was performed:
First, the state was divided into five zones: Central, North-east, Northwest, Southeast, and Southwest. Subsequently, the coordinates of the distribution centers and headquarters were defined in order to locate them on a map, establishing each center and headquarters as a registry with its respective geographic information. Using an innovative methodology of creating polygons over the buildings, the perimeters were determined, and finally, with the anonymized cell phone positioning data, it was possible to define the number of people who visited the distribution centers and a location in a given period of time.
Also see: “Big Data to Infer Relationships between Companies.”
[button button_text=”Like what you see? Request a free DEMO” button_style=”style-1″ button_arrow=”true” button_rounded=”true” font=”Default” button_size=”medium” font_size=”” button_icon=”” button_align=”center” padding_v=”” padding_h=”” button_link=”/request_demo/” link_open=”_self” href_title=”” id=”” class=”” bg_color=”” text_color=”” border_size=”” border_color=”” border_radius=”” h_bg_color=”” h_text_color=”” h_border_size=”” h_border_color=”” h_border_radius=”” margin_top=”” margin_bottom=”” margin_left=”” margin_right=””]
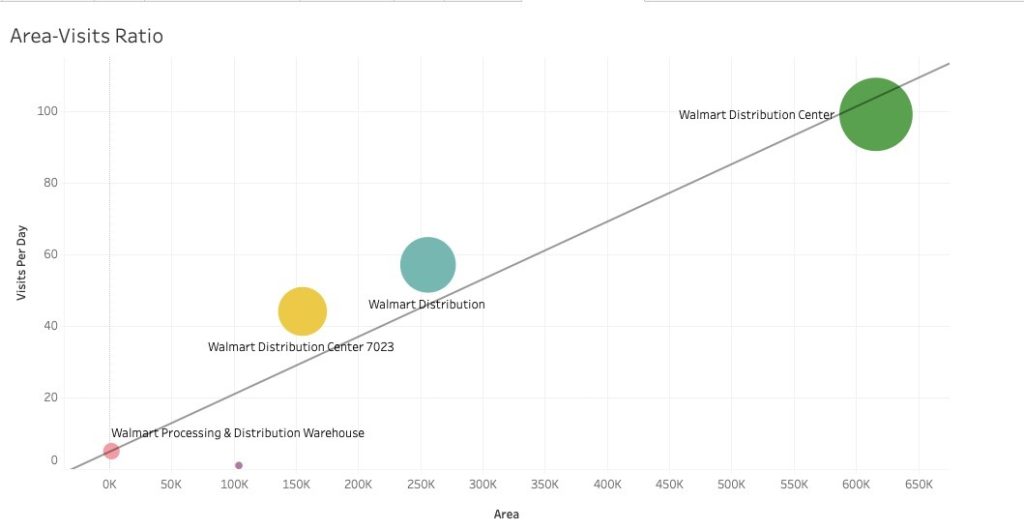
This visualization shows the relationship between distribution center square footage and visit volume. A linear regression line was included, representing a proportional growth between visits with distribution center square footage. Therefore, if the property is close to the line, it means that the distribution center space is being better utilized. With this in mind, it could be calculated that:
The size of the circle represents the number of visits. We can see that the larger the size of the perimeter of the distribution centers, the greater the number of visitors.
As can be seen, almost all facilities seem to line up close to the trend, which shows a formidable ratio between perimeter and visitor volume.
The only exception is the Alcachua center (purple circle), as it is the only spot that seems to be wasting its space capacity. Although it does not rank last in terms of floor space, it is the center with the least footfall.
This type of model helps organizations to identify and characterize the direct relationships that exist between relevant variables such as physical space and foot traffic at each point, which becomes a highly valuable input for finding trends and optimizing processes in supply chains.
Contact us to get more information about our business intelligence solutions
