In today’s Real Estate market, investors looking to maximize their returns must use innovative tools and technology. Heat maps provide valuable insights into market trends, and enables data-driven decision-making.
This article explores property and housing market heat maps, covering their benefits, practical applications, and available tools. We will also discuss how they improve real estate investment.
- What is a Real Estate heat map?
- Why heat maps are improving Real Estate analysis?
- How does a Real Estate heat maps work?
- Benefits of using Real Estate heat maps tools
- 2 expert tips for using Real Estate heatmaps correctly
- Success Stories: How are decision-makers using Real Estate Heat Maps?
- Conclusion: Mastering Real Estate Investment with Heat Maps
What is a Real Estate heat map?
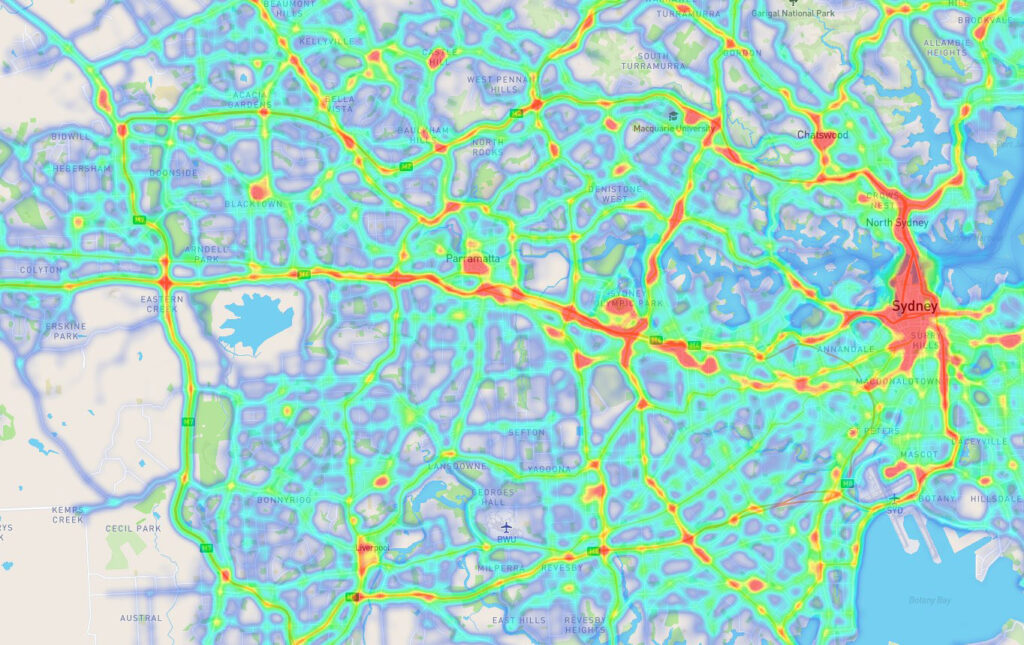
Real estate heat maps are dynamic data visualization tools that show complex geographical information about property markets in an “easy-to-analyze” format.
These maps visually represent real estate market insights by using color gradients. Their objective is to illustrate different property and market data, such as home prices, rental rates, and market trends. Therefore, heat maps empower investors to develop well-informed strategies regarding potential investment properties.
Investors search for the best place to buy properties for development. Before, they used financial studies. Now, they use foot traffic, Big Data, and location data to make it easier.
Why heat maps are improving Real Estate analysis?
Heat maps are changing the real estate investment landscape by offering an efficient and comprehensive method to evaluate potential investments.
These tools enable investors to:
- Identify high-ROI locations.
- Analyze rental market trends.
- Pinpoint emerging markets.
For example, you can use rental heat maps to quickly assess neighborhood analysis. Of course, having the right data can ease any decision process, increasing your chances of investment success.
You may also like to read: How Big Data Analytics helps in the Real Estate Industry?
How does a Real Estate heat maps work?
A real estate heat map combines predictive models, property data, and points of interest to provide valuable insights.
With PREDIK Data-Driven’s heat map solutions, you can analyze locations and identify areas with the most feasible sales prices, rental rates, cash yield, and occupancy rates.
For example, our heat map tools can highlight low-price areas by selecting a city and filtering sales prices. This gives investors a rough idea of the Real Estate prices in those areas. Also, through these insights, decision-makers can determine if the site fits their investment goals.
Once the buying or rental strategy has been decided, you can identify specific areas with a high cash return.
You may also like to read: GIS Mapping: A brief guide
Benefits of using Real Estate heat maps tools
Companies who have embraced real estate heatmap tools have seen significant improvements in their strategies. By having key market information, real estate professionals have managed to identify profitable opportunities and avoid potential pitfalls.
Identifying high-ROI investment locations
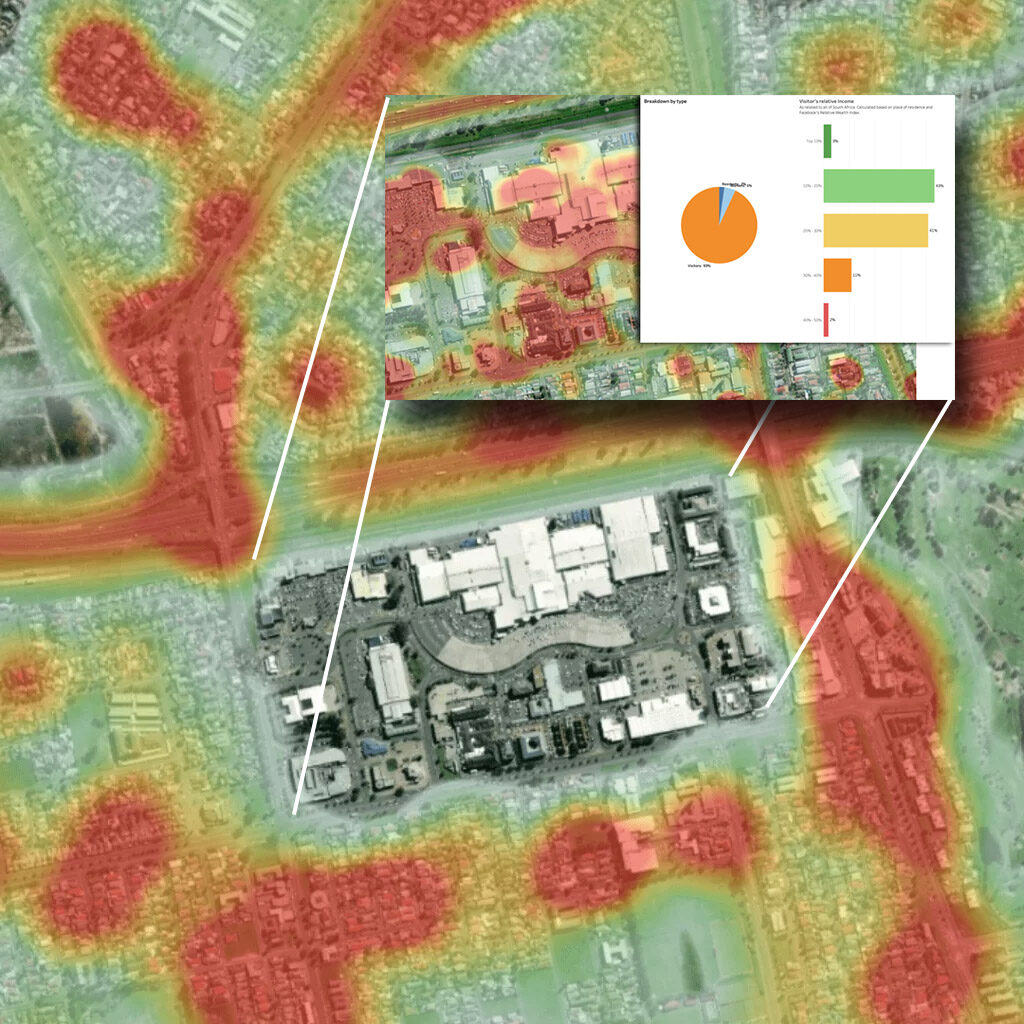
Real estate investment Heat Maps allow investors to locate housing markets with high potential for ROI in real time. How? By displaying key metrics such as cash flow, rental income, and cash on cash return.
By focusing on these high-ROI areas, you can maximize their chances of success. Also, you can ensure to make better and more intelligent investment decisions.
Analyzing Rental Market Trends
Rent heat maps provide valuable information about rental market trends, including occupancy rates, rental properties patterns, and listing prices. By analyzing these trends, investors can identify areas with strong rental demand and adjust their investment approach accordingly.
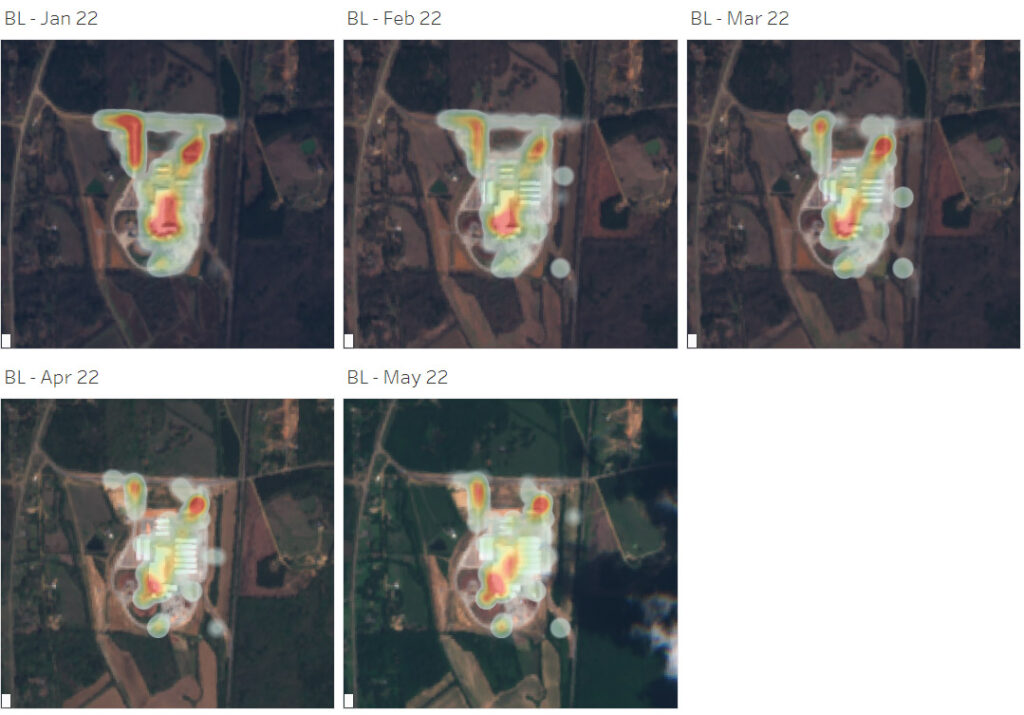
Evaluating Property Value Growth Over Time
Property value heat maps reveal patterns in property value growth over time. These patterns help professionals identify areas with strong potential for appreciation.
By monitoring these trends, you can understand where to allocate your investment for long-term gains.
Pinpointing Emerging Markets
A property heat map can help investors discover emerging markets before they become hotspots. By identifying the hottest real estate markets early, you can capitalize on lower property prices and benefit from future growth.
2 expert tips for using Real Estate heatmaps correctly
Combining heat maps with in-depth market research
Heat maps for real estate are helpful, but it’s essential to do market research too. This means examining some aspects of the area, like nearby public services, job growth, population growth, rental demand, and the overall local economy.
Constant monitoring market changes
Constant monitoring of market changes and adapting investment strategies, in consequence, can help you identify opportunities before others do.
Ready to use Data to make better and faster decisions? Talk to an expert
Success Stories: How are decision-makers using Real Estate Heat Maps?
Overcoming Market Uncertainty with Heat Maps
In times of market uncertainty, real estate heat maps have proven valuable for many investors. In our experience, clients have told us that heat maps have provided them with the following:
- Better visual representations of market trends.
- The necessary insights to quickly and effectively adapt their strategies to changing conditions.
- Valuable data to anticipate risks and maximize potential returns.
Finding “promising” markets
An article by SparkRental explains how, a few years ago, Boise (Idaho) was seen as a promising market. The city had a 3.08% population growth rate and an unemployment rate of just 2.9%.
Using heat maps and analyzing these factors, investors made well-informed decisions to find and invest in markets similar to Boise.
Analyzing a city
The post-COVID crisis brought uncertainty to housing interest rates. This caused many investors to look at big cities with different eyes.
For example, a company looking to invest in the Chicago real estate market started using heatmap. Its objective was to quickly identify neighborhoods with a high cash-on-cash return, such as Lincoln Park or Lakeview.
By targeting these areas, the investor optimized its rental strategy and increased its success rate.
Conclusion: Mastering Real Estate Investment with Heat Maps
Tools like house price heat maps have become essential tools for savvy investors. They provide valuable insights into high-ROI locations, rental market trends, property value growth, and emerging markets.
By leveraging these powerful data visualization tools, investors can make informed, data-driven decisions that lead to successful real estate investments.