Location Analytics has changed the way marketing and commercial strategies are defined in the fast-food restaurant franchise business.
Understanding consumers’ behavior patterns are critical for all types of restaurants. Big Data tools play a very important role in this analysis since they make it possible to measure the foot traffic and mobility patterns of a specific area or location, among other variables. With these analyses, businesses can understand and predict the performance of their stores, as well as estimate the competitors’ turnover or identify areas for the opening of new locations. (site selection).
With Big Data mining techniques, it’s possible to analyze foot traffic at a specific venue, and through the combination of this information with spatial data, companies can get valuable insights about the performance of their points of sale and other points of interest (POI).
The correlation between foot traffic and sales in fast-food restaurants has been well studied and proven, so the development of this kind of research has become a priority in the site selection process.
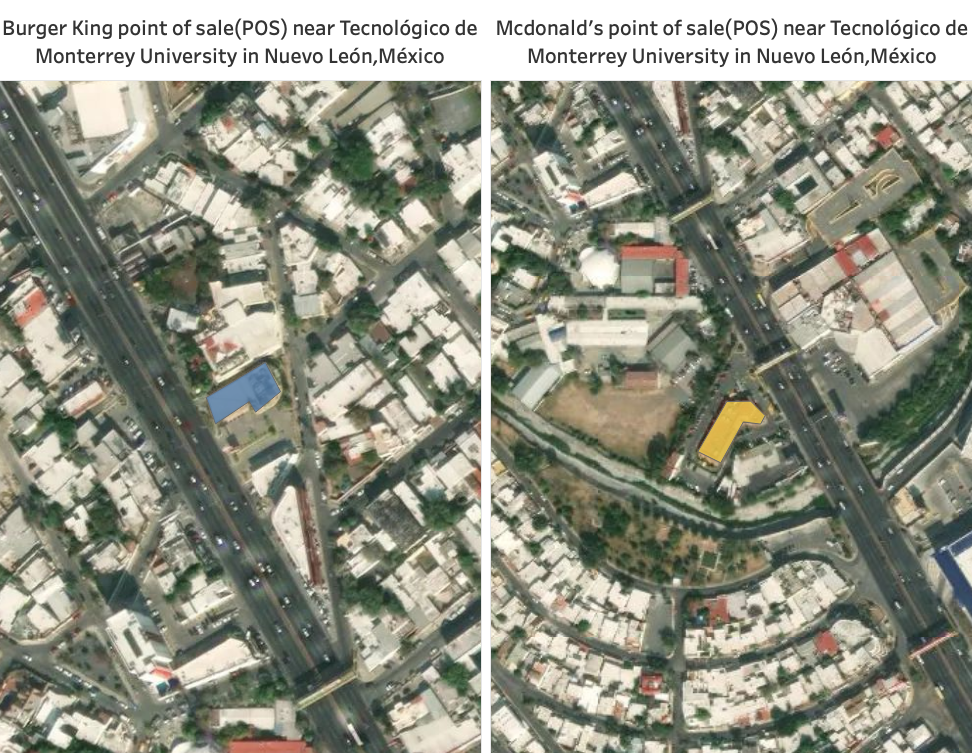
Case Study: McDonald’s Vs. Burger King Garza Sada (Monterrey Nuevo León, Mexico)
At PREDIK Data-Driven we conducted a detailed study of two restaurants of the franchises McDonald’s and Burger King: McDonald’s Garza Sada and Burger King Garza Sada, both being the closest to the Tecnológico de Monterrey university campus.
We analyzed the foot traffic in the venues and in the immediate surroundings, with the objective of understanding the behavioral patterns of the people who visited both brands. This analysis seeks to answer the following questions:
How are the visits distributed in each establishment?
Something to keep in mind is that this data resolution allows us to see in which specific areas inside the restaurant the movement of people are concentrated. This is very useful when conceptualizing the infrastructure design and the internal distribution that conforms to each restaurant.
You may also be interested in: “Location analytics can drive retailers to success: Case Study Home Depot Vs. Ace Hardware“
This heatmap shows the concentration of people inside the restaurants that Burger King and McDonald’s operate around TEC de Monterrey:

Which one of these franchises is the most visited?
Percentage distribution of visits registered in the period analyzed:
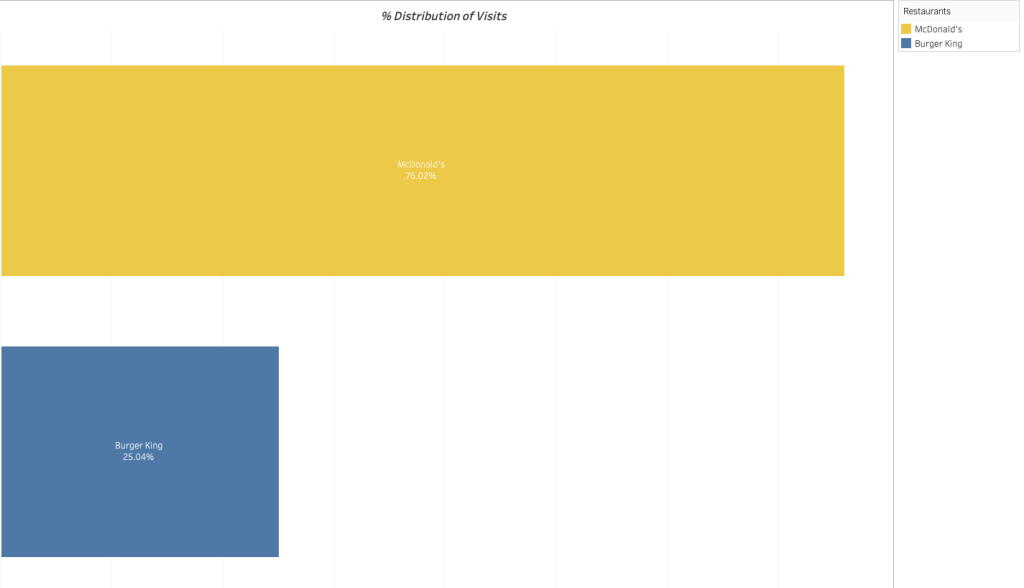
By analyzing the footfall in both restaurants in the same period, we can identify that 76% chose to visit McDonald´s, while the remaining 24% were at Burger King, which has a correlation with the location of the restaurants and their popularity.
[button button_text=”Like what you see? Request a free DEMO” button_style=”style-1″ button_arrow=”true” button_rounded=”true” font=”Default” button_size=”medium” font_size=”” button_icon=”” button_align=”center” padding_v=”” padding_h=”” button_link=”/request_demo/” link_open=”_self” href_title=”” id=”” class=”” bg_color=”” text_color=”” border_size=”” border_color=”” border_radius=”” h_bg_color=”” h_text_color=”” h_border_size=”” h_border_color=”” h_border_radius=”” margin_top=”” margin_bottom=”” margin_left=”” margin_right=””]
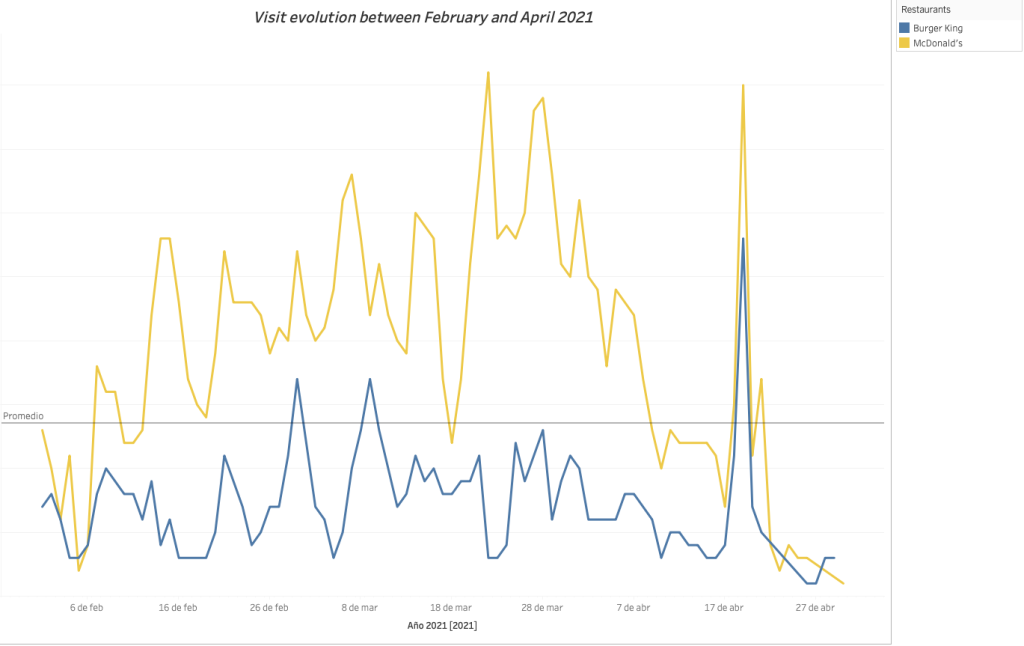
It’s also possible to see the evolution of footfall over time, which can be very useful to identify trends in the behavior of both actual and potential customers.
Analysis of the evolution of visits between February and April 2021:
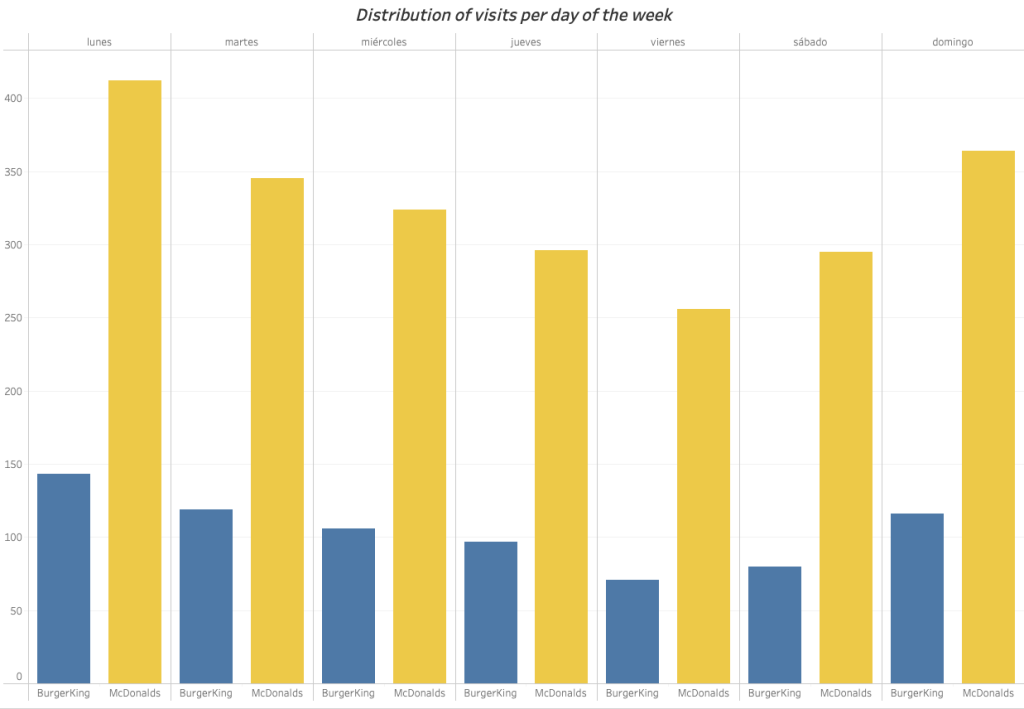
Recognizing customers patterns: What days of the week are the busiest?
One of the most interesting applications of location analytics is that it provides a better understanding of consumer behavior patterns, and offers valuable insights to design marketing and commercial strategies.
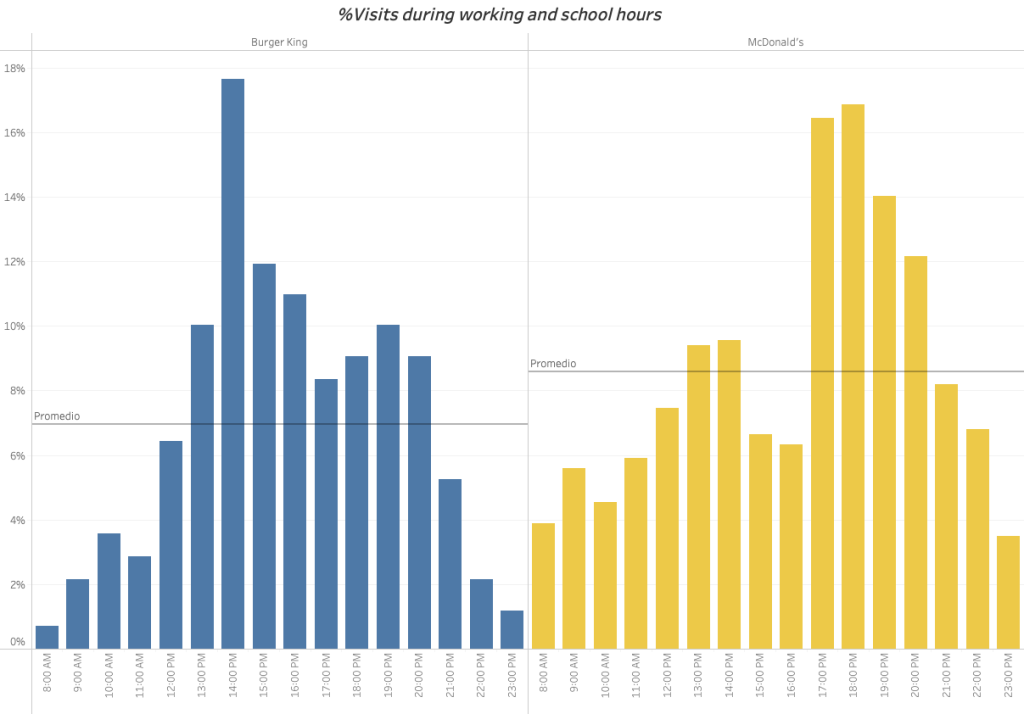
With a deeper analysis of the data, we can determine the visits per hour. This analysis is very useful to know the busiest times of the day each restaurant presents.
What are the characteristics of the surrounding area of both restaurants?
Although visits are correlated with the performance of any retail venue, they are not the only key factor for success. Another fundamental aspect that should be analyzed is the location environment since it allows to identify the competitors´ restaurants and understand their performance: estimate the number of visits each one receives, gather insights about the potential customers that move around, and how they behave.
Heatmap showing foot traffic around both restaurants:
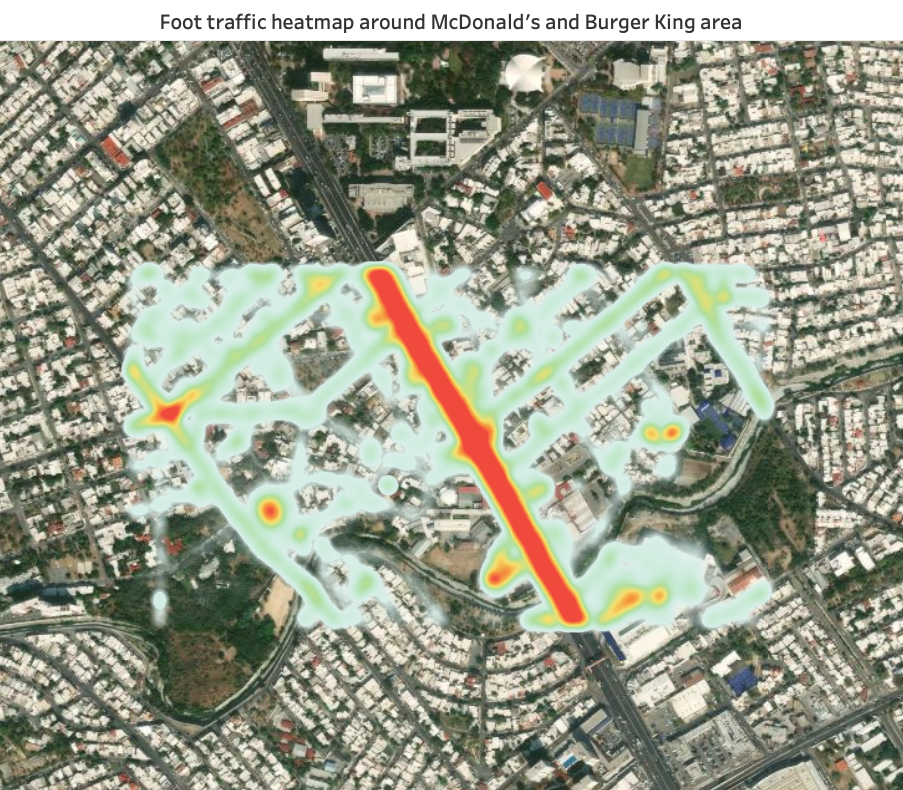
The environment analysis gives us a more general picture of the area and how many people move around. This data, combined with other factors, provides in-depth insights when it comes to predicting the revenue of any retail venue.
Read about: “Analysis and characterization of points of interest.”
What other insights can be obtained by analyzing footfall at a point of sale?
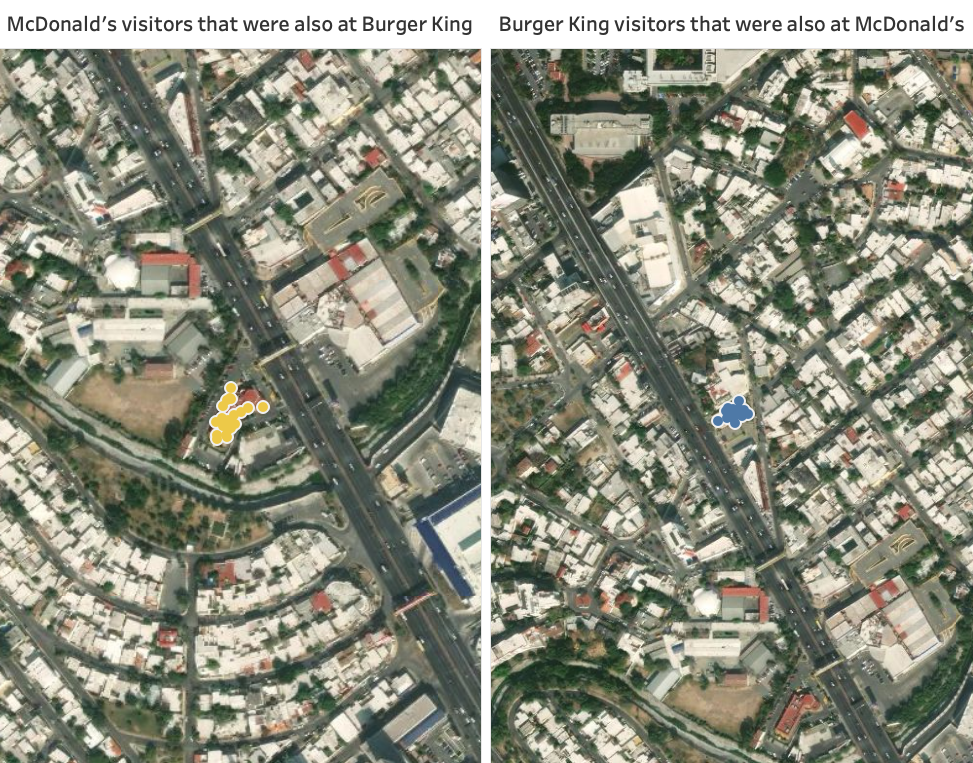
Understand which customers both restaurants share
By analyzing data over a given period of time at a specific location, such as a restaurant, it’s possible to dimension de amount of consumers that were at both restaurants.
These solutions benefit any type of business, an example of this is another case study that was conducted to compare two of the most popular supermarkets in the city of Guadalajara Jalisco, Mexico, the findings were more than interesting. Read more about this case: “Walmart Vs. Soriana: Consumer Foot traffic Analysis“
- Customer Profiling
Another possible use is customer profiling since it is possible to know in which other places (stores, restaurants, shopping malls, residential areas, among others) the people who visited an establishment were. Thus, Burger King and McDonald´s can know how their customers behave, since they can know where and how long they were before and after visiting their restaurants. This allows them to generate high-value insights to optimize the understanding of current consumers and search for new potential customers with similar behaviors.
- Identifying ideal areas in expansion and site selection strategies
With mobility data, it is possible to clearly understand the behavior of the people who pass through a given area, understand what they are like, their tastes, preferences, socioeconomic level, and purchasing potential. This, together with an in-depth analysis of the commercial establishments in the area in question, becomes a crucial factor in determining the best locations for the opening of new stores.
- What is the revenue potential of my competitor?
Through machine learning models, it is possible to predict the revenue of a competitors´ store. With these models, Burger King could get to estimate the revenue potential of its competitor McDonald´s in a specific week, month, or year. These models can also be used, for instance, to predict the revenue of an outlet that is about to open. This is ideal to complement feasibility studies for new stores in expansion plans.
At PREDIK Data-Driven we develop all types of business intelligence for our clients. Learn more about how we do it.
Learn about how mobility analytics help franchises. Contact us!
