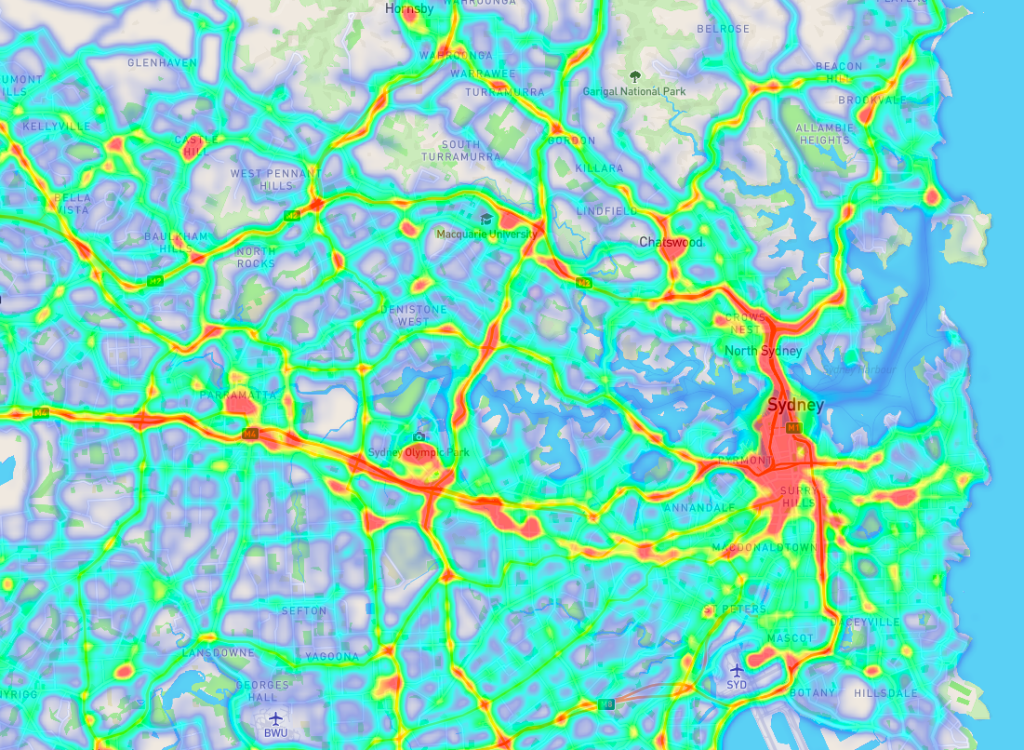
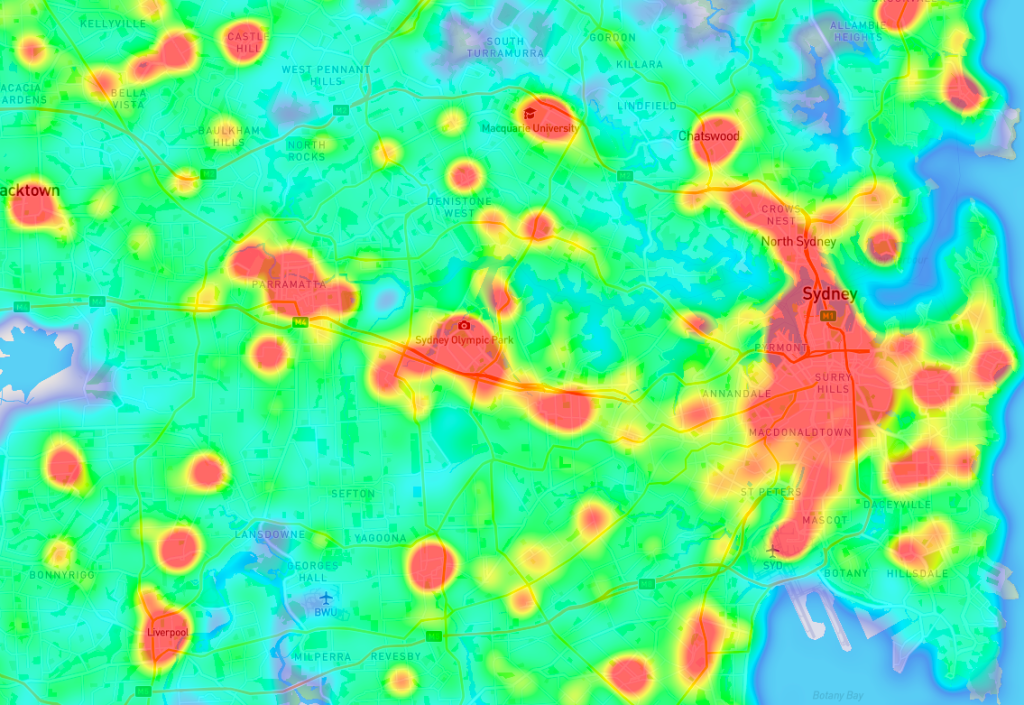
Heat maps are used by retail giants to understand pedestrian and vehicular footfall patterns and consequently optimize their strategies for opening new stores.
At site selection solutions. In this case study, we will talk about how a transnational chain of stores dedicated to the sale of household goods was able to reduce its investment risks by selecting the most suitable locations with the necessary characteristics to attract its target consumers thanks to a foot traffic analysis heat map.
CASE STUDY: LOCATION INTELLIGENCE APPLIED TO THE SITE SELECTION PLAN OF A CHAIN OF STORES FOCUSED ON THE SALE OF FURNITURE AND HOME PRODUCTS IN THE CITY OF SIDNEY, AUSTRALIA.
Problem to be Addressed
This business group, dedicated to the commercialization of furniture and household goods, needed to identify the most suitable areas for the opening and management of new stores in the city of Sidney, Australia, in order to maximize the performance of their establishments.
Our solution
At PREDIK Data-Driven developed a heat map that collects visual geographic information on vehicular and pedestrian foot traffic mobility patterns in Sidney Australia.
Using spatial data and mobility data, we tracked movement in real-time creating a heat map that helped us identify foot traffic patterns around and within the various retail outlets, allowing us to categorize stores and profile visitors as floating population, workers, and residents to understand their preferences when selecting household goods.
The same methodology was applied to the potential expansion areas, allowing us to estimate the relative wealth index level of visitors and their preferences, and to cross-check this with the different areas where the expansion of new outlets would be ideal.
Through this type of analysis we were able to identify which places consumers would visit the most, in addition to the different points of sale, and consequently to determine which places they visited before and after being in the establishments.
Final Result
With the mapping of pedestrian and vehicular footfall in Sidney, we obtained detailed information on the mobility behavior patterns throughout the area, allowing our client to determine which streets, avenues, and places the concentration of people and vehicles are most common in a given period of time, and thereby select potential site selection locations that improved the profitability of their new stores.


