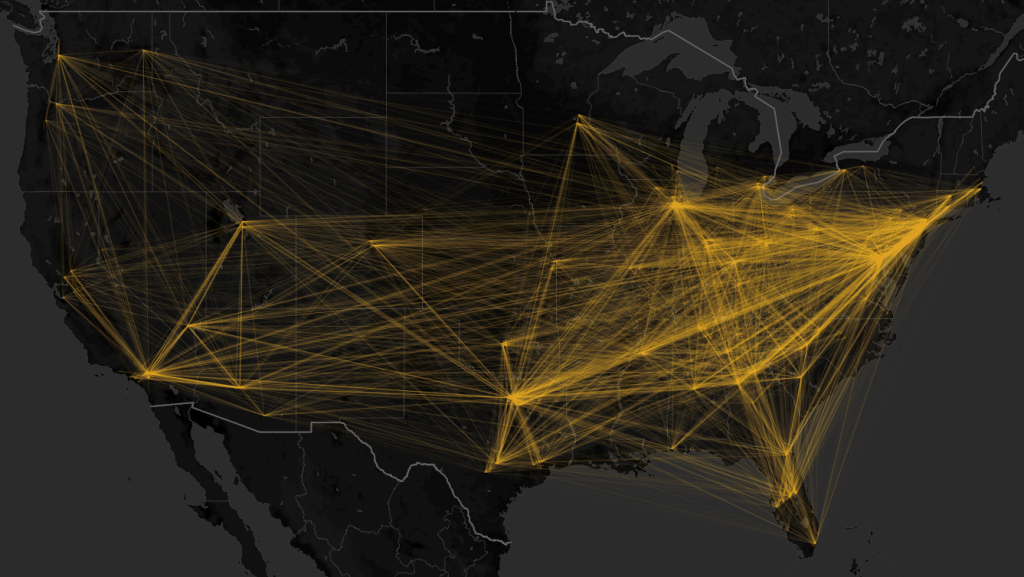
New technological tools improve logistics processes by generating visualizations that map in thousands of assets identifying cost trends, performance along maritime, land and air routes among others.
New technological tools, such as GIS, Big Data, mobile devices, and artificial intelligence, accumulate huge data sets within the logistics processes of any business, so using the right techniques, it is possible to improve operations and generate visualizations that can show a detailed mapping of thousands of assets worldwide, thus being able to identify cost trends, yields along maritime, land and air routes, compare historical arrival and departure times of carriers, among many others.
Also read: “How to Increase Foot Traffic in stores?“
Flowchart and network visualization helps to trace relationships between millions of points along a route, generating relational connections within any area, making billions of data records accessible that can be expanded layer by layer, to detect mobility patterns on a national, regional and local scale, detect unexpectedly large flows between several points, identify cost saving opportunities and analyze new markets and routes.
“This image showed in this post shows a calculation of the relationship and connection intensity of the different distribution centers Amazon based on mobility and geospatial data.”
External factors, such as traffic, weather and elevation, can affect the time it takes carriers or shipments to get from one point to another. By mapping the timing of a service area it is possible to observe external events that have historically affected or improved delivery processes as they move through the real world, providing insight into what service levels can realistically be achieved in new and existing service areas.
There are different benefits within the different logistics processes of any business.
[button button_text=”Want to know more about our location intelligence solutions? Request a free DEMO” button_style=”style-1″ button_arrow=”true” button_rounded=”true” font=”Default” button_size=”medium” font_size=”” button_icon=”” button_align=”center” padding_v=”” padding_h=”” button_link=”/request_demo/” link_open=”_self” href_title=”” id=”” class=”” bg_color=”” text_color=”” border_size=”” border_color=”” border_radius=”” h_bg_color=”” h_text_color=”” h_border_size=”” h_border_color=”” h_border_radius=”” margin_top=”” margin_bottom=”” margin_left=”” margin_right=””]
In supply chains, it optimizes downtime, locating the exact points of deliveries and removals, ensuring that drivers have the best possible routes, visualizing them in real time and based on route characterization, thus minimizing delivery and removal times by providing accurate arrival and departure times.
You may be interested in: “POS Analytics based on Big Data.”
In vehicle fleet control, tracks in real time with maps, planning and executing the most efficient routes based on mobility and geospatial road data, thus creating on-time delivery predictability with accurate estimates and notifications.
Increases the safety of your loads and carriers, avoiding distractions and risky zones, by integrating speed limit and accident warnings to promote safer driving.
Improves route planning by creating powerful dashboards and real-time metrics for asset tracking, manual dispatching and reporting, focusing on delivery tracking and notifying workers of pending tasks.
Contact us for more information about our supply chain location analytics solutions.


