Analytics based on Big Data allows mall operators to maximize revenues and visits by better selecting tenants, optimizing mall design, determining rents, establishing signage and advertising campaigns.
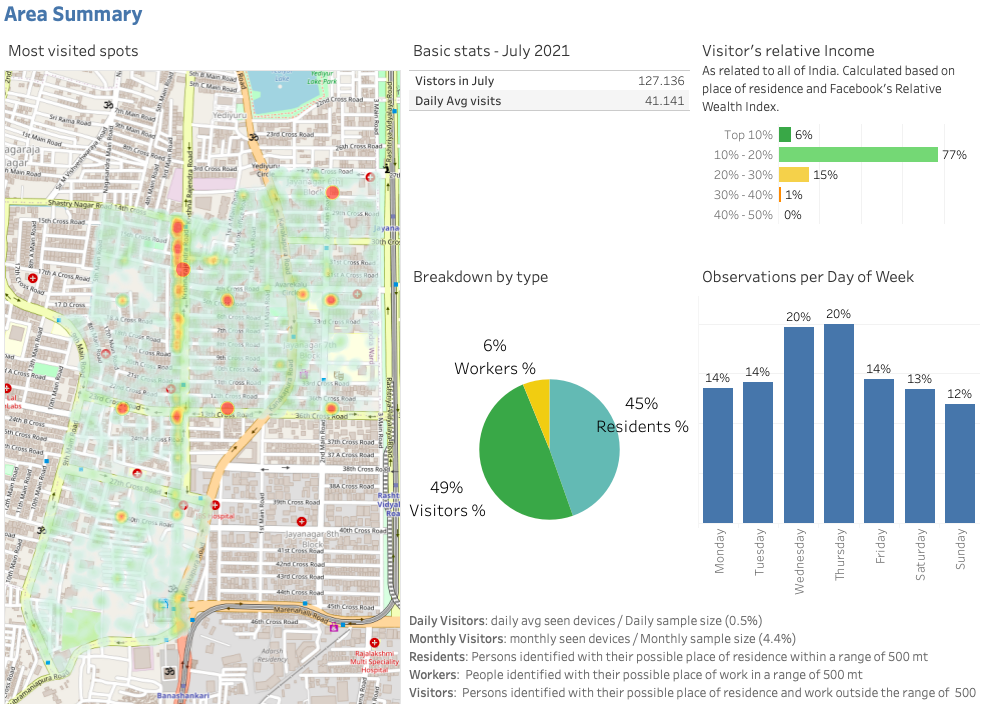
New technological tools allow mall operators to measure the number of consumers spending in and out of stores, the time they spend in and out of stores, know their relative wealth index, and understand visitor behavior patterns, helping to determine the best mix of stores, site infrastructure, rent price range and implement more efficient signage and advertising.
What benefits does mall analytics bring?
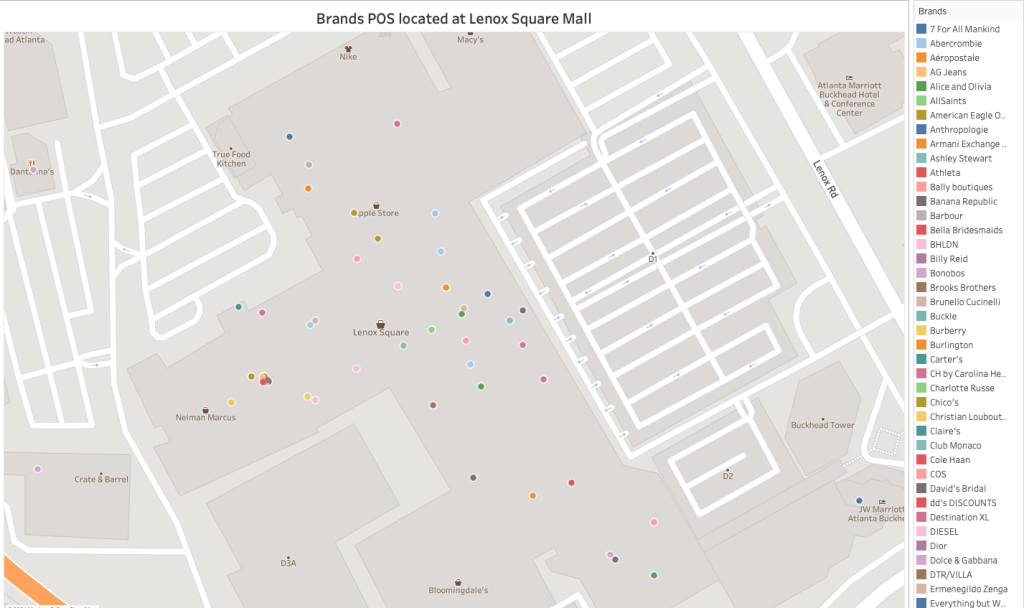
Obtain the optimal mix of stores and categories
Revealing typical walk routes within the mall and conversion patterns between categories, allowing you to identify the performance of each store by determining whether and by how much the presence of one brand increases or decreases sales in other stores. Answering questions such as:
- What types of stores best attract consumers who live or work in the mall’s catchment area?
- Are my anchor stores driving foot traffic and sales in my mall?
- Which tenants create value despite their own low sales performance?
- What combinations of stores or categories produce the mall’s highest collective sales?
Matching tenants to locations
Identifies the different obstacles in the sales conversion funnel, proximity rate, inbound and outbound traffic, number of conversions and reasons for failed conversions, maximizing sales, and establishing lease fees depending on the location of the brand within the mall.
You may be interested in “Walmart Vs. Soriana: Consumer Foot traffic Analysis“
Establish a price range for each lease
Through characterization of the points of sale, tenants and their consumers are classified, studying not only sales per unit, but also occupancy costs and profits, and thereby setting prices depending on the proximity of the unit to the entrance of the mall and the brand’s price positioning.
Tenant performance assessment
Allows data to be collected from sensor devices to identify proximity conversation rate and traffic conversion rate on defined roadways based on tenant performance.
Prioritization of billboards and digital signage
Helps develop better strategies for revenue generation by identifying the most visited stores and mall locations, allowing you to plan strategies to advertise sponsored products through defined avenues where consumers are most likely to engage.
Also read: “Location analytics can drive retailers to success: Case Study Home Depot Vs. Ace Hardware“
Develop the mall infrastructure
From information gathered from events, customer service points, and social media surveys, helps to identify the rate of footfall during different seasons to revolutionize the infrastructure and improve consumer interaction in the mall.
Data-driven insights from mall analytics provide advantages at various levels of business operations and maximize revenue.
The analytics performed by PREDIK Data-Driven provide a clear understanding to mall operators on how to increase revenue by converting the traditional mall into a hybrid mall.
[button button_text=”Want to know how this type of solution helps your company? Request a free call with one of our big data specialists.” button_style=”style-1″ button_arrow=”true” button_rounded=”true” font=”Default” button_size=”medium” font_size=”” button_icon=”” button_align=”center” padding_v=”” padding_h=”” button_link=”https://servicioalcliente1-centralamericadata1.zohobookings.com/#/customer/predikdatadriven” link_open=”_self” href_title=”” id=”” class=”” bg_color=”” text_color=”” border_size=”” border_color=”” border_radius=”” h_bg_color=”” h_text_color=”” h_border_size=”” h_border_color=”” h_border_radius=”” margin_top=”” margin_bottom=”” margin_left=”” margin_right=””]
