POI characterization through Big Data has become more frequent as it allows the implementation of strategies and site selection solutions within the various business sectors.
Leaders use these techniques to make more efficient and concise decisions that generate greater profitability by maximizing revenues and optimizing costs.
Case Study: Visitor profiling at Perisur, one of the most exclusive shopping malls in Mexico City.
PREDIK Data-Driven conducted a detailed study of Perisur Mall, the third-largest shopping mall in Mexico City. Through a foot traffic analysis and POI characterization of the people who visited this shopping mall, we estimated the footfall, identified the most and least crowded places, visitors classification, observations per day, the most and least visited places by customers of the establishment as well as their relative wealth index characteristics.
In this case study, we analyze the foot traffic and the immediate surroundings of the point of interest, with the objective of identifying the behavioral patterns of the people who visit the establishment. This analysis aims to answer the following questions:
Which areas and locations have the highest concentration and foot traffic?
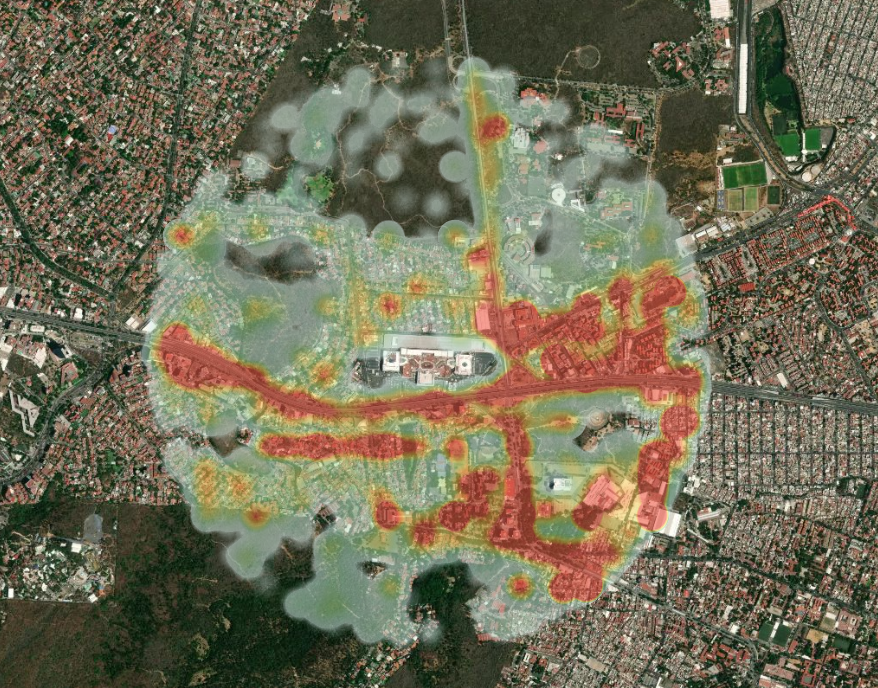
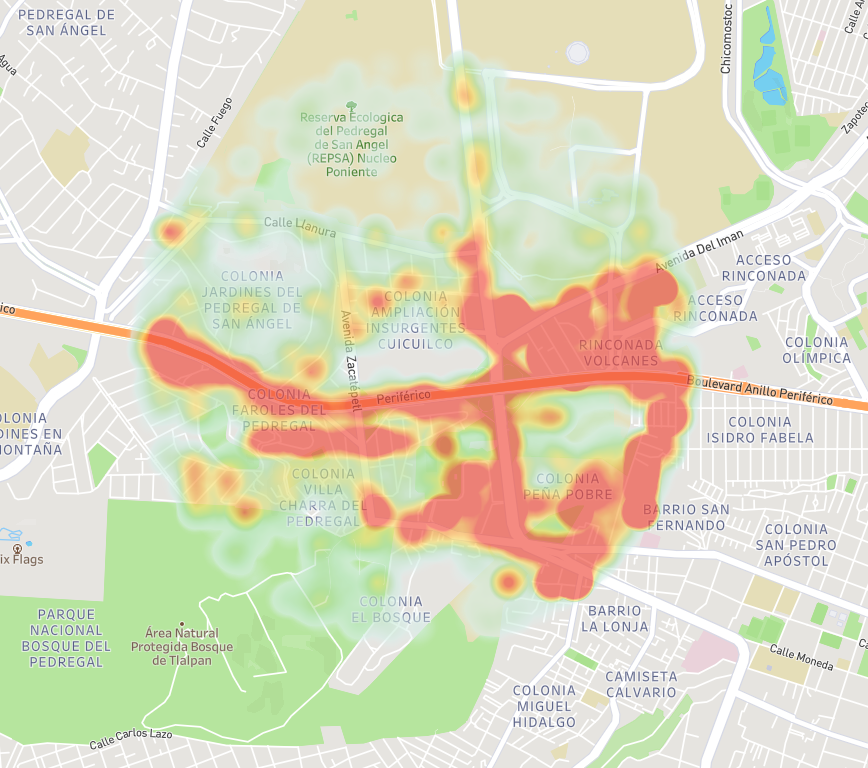
By generating a heat map that covers the entire POI analyzed, we realized that the most prominent areas of foot traffic are Periferico Sur Avenue and Insurgentes Sur street.

In these analyses, there are several calculations with which it is possible to identify whether the registrations are automobiles or pedestrians, which helps to generate more detailed and focused information on consumers and the market potential of the area.

What is the estimated evolution of visits around Perisur Mall?
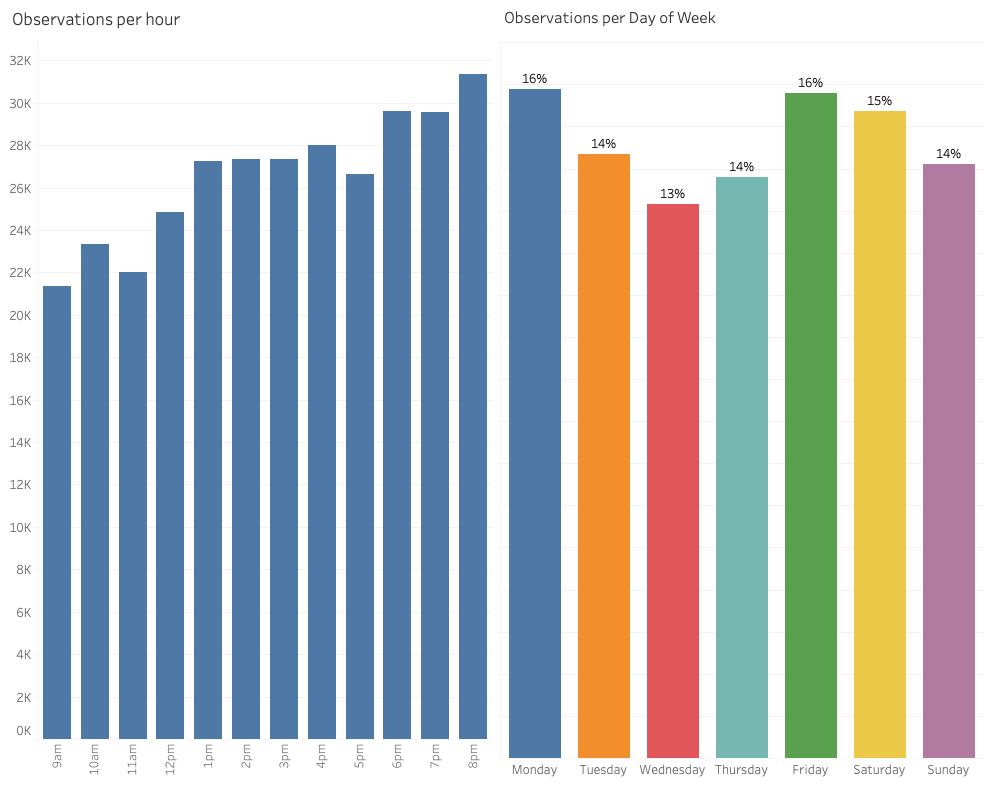
With these analyses, it is possible to make a comparison of the evolution of visits identified during hours, months, days, and years of a POI, generating a detail of the average number of visits that helps businesses to have an idea of the market or the level of potential customers in an area, identifying seasons of high and low foot traffic.

Visits distribution by the hour, day, month and year is an important method when characterizing and analyzing a POI, since it allows: estimating the times and schedules of certain premises or locations and knowing when they are more and less crowded, estimating the average time that certain records are spent in or near specific areas, finding the times of day that are more and less favorable for implementing a product or service.
Which is the classification of people who visited Perisur Mall?

With a Global Relative Wealth Index data layer, collected by Facebook, the socioeconomic levels of the habitants and their status were estimated. In parallel, applying spatial data analysis techniques, corporate buildings, residential areas, schools, etc., are located; The combination of these two analyses allows classifying inhabitants as students, workers, residents, or “floating or instant population”, that is, people who only transit through that area to get to another location.
What other locations are preferred by visitors to Perisur Mall?

These analyses go into such detail that they allow us to identify and understand visitor behavior patterns and thus observe which are the potential markets, the places that generate the most interest, and their preferences.

