Retail companies are already implementing Big Data and geolocation analytics tools to understand consumer mobility patterns, measure foot traffic in each store, understand the performance at their points of sale and estimate competitors’ turnover.
Big data techniques allow the recollection of large volumes of geospatial and anonymous data from various mobile devices such as cell phones, computers, tablets, etc., making possible to generate different detailed and general analysis that help to solve any kind of business problems in any specific sector.
The retail sector can obtain great benefits from these tools. By analyzing consumer mobility patterns, it’s possible to identify, count and characterize the people who visit the facilities in a given period of time, retailers can also know the pedestrian and vehicular traffic flow around the stores or main avenues identifying a potential POS, and to even estimate the amount of money that the competitors generate.
A detailed analysis makes possible to identify trends and obtain a deeper knowledge about the behavior of clients that are visiting the stores.
Case Study: Home Depot vs. Ace Hardware in California, U.S.A.
At PREDIK Data-Driven we conducted a study of two well-known home retail stores in the state of California, Home Depot and Ace Hardware, collecting and analyzing data from ten POS, five from each of the two companies.
Through the collection and analysis of geospatial data at each of the identified stores, we found answers to the following questions:
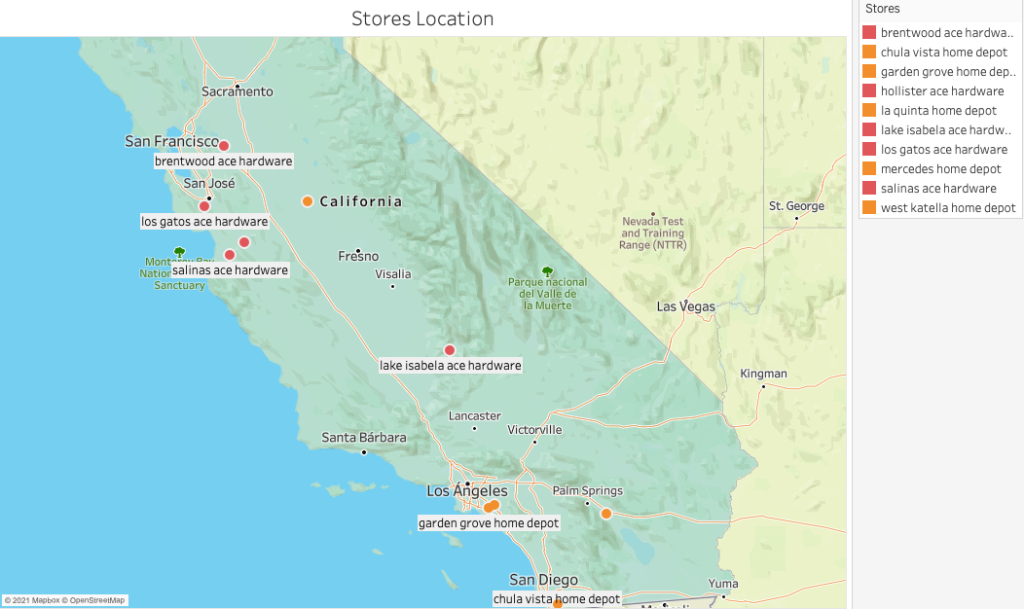
Geographic distribution: how do ACE Hardware and Home Depot share the market statewide?
We began by locating ten POS in California, establishing the different analysis locations, where we observed that the site selection process carried out by Home Depot led them to locate their stores further south in California. We also identified that Home Depot Garden Grove and Home Depot West Catella, which are both located in Los Angeles, are the only ones with a very clear proximity, a wise decision taken by Home Depot to supply the market demand of the city with the largest population in the state.
On the other hand, Ace Hardware’s POS are more likely to be located in Northern California, where its closest stores are Ace Hardware Salinas and Ace Hardware Hollister.
Time spent at the POS: How long do customers stay in each store?
By collecting and analyzing mobility data, we calculated the total percentage of hours that the different customers spend inside the stores, differentiated by brand.
How long do my store manages to retain customers at the POS?
Through the collection and analysis of historical geospatial data on a specific period of time, it’s possible to calculate the total average of hours customers spend inside a POS and compare them with the stores of the same franchise or with the competitor’s stores.

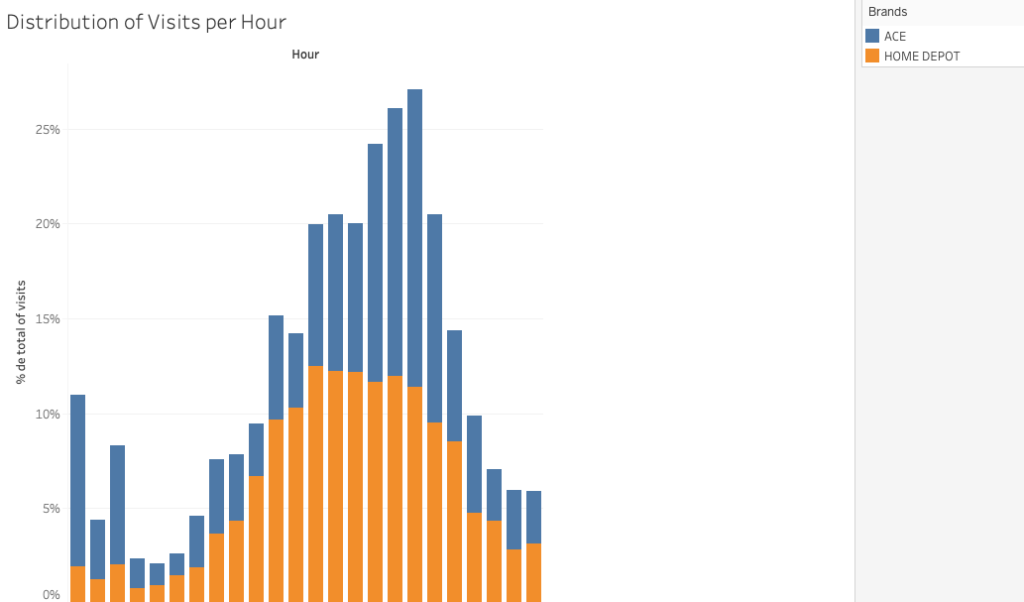
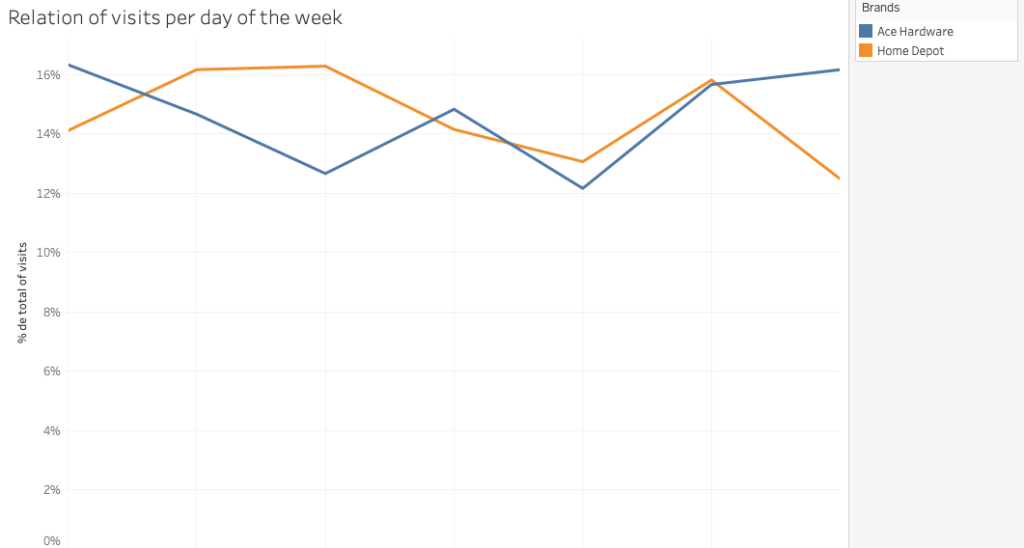
What times and days of the week register the highest visitation rate at each store?
With a general analysis segmented by days of the week, the proportion of visits at the different POS can be differentiated, helping the retailers to get a referenced point of view for the implementation of new strategies, with the objective of being able to reach the visitation rate goal of the days with the highest visits and implement the same tactics on the days with the lowest visitation rate.
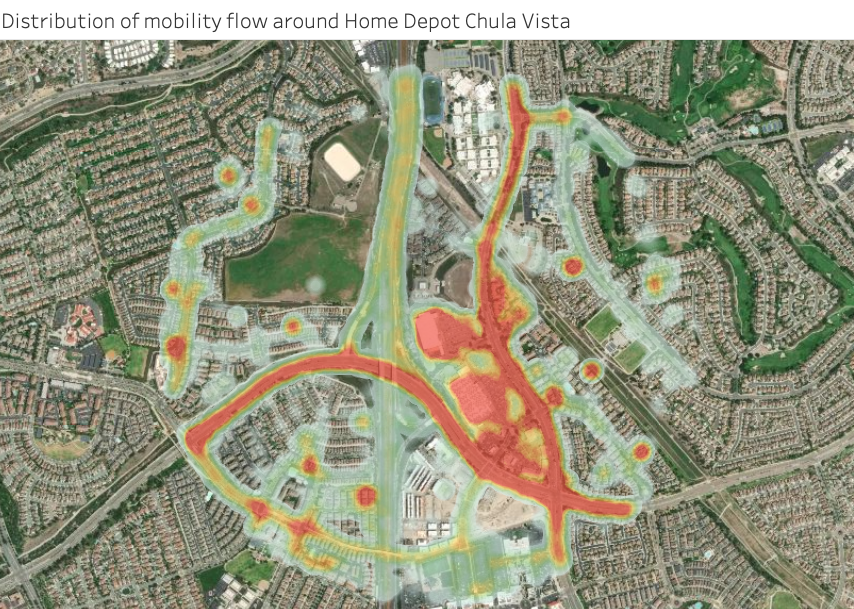
By analyzing the foot traffic in the surrounding areas of each of the POS, we were able to analyze the distribution of the consumers´movement around the stores. As observed in the visualization below, this type of analysis allows to combine both the geographic location and the mobility flow. This offers great insights on how customers and potential customers move around a specific store or area of interest. It also helps to enhance the site selection process for new POS.
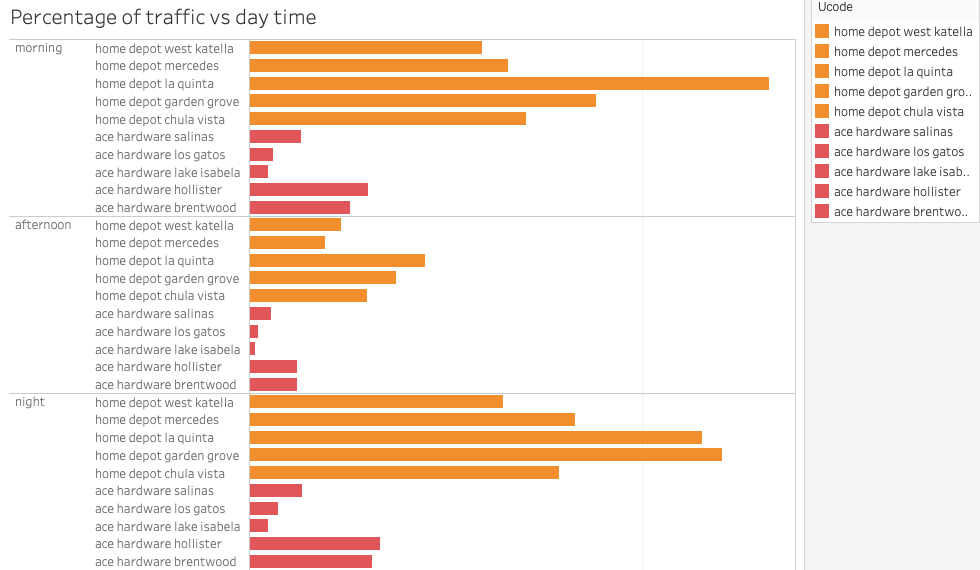
Most visited daytime at each POS
It’s possible to analyze the distribution of visitors that the ten stores considered in the analysis received throughout the day and segment it by morning, afternoon and evening, in order to optimize the marketing strategies and improve the targeting depending on the type of customer, the store, and moment of the day.
At PREDIK Data-Driven we develop all kinds of business intelligence and location analytics solutions for our clients. Learn how we do it.
Want to see how we can help you improve your stores´performance? Contact us!
