There’s no doubt that steel is an essential metal for the US industry; from home appliances to cars, thousands of companies depend on it.
Unfortunately, like other industries, the COVID-19 pandemic and the most recent conflicts have disrupted the steel industry entirely. In the last two years, steel has faced scarcity, constant price changes, and several “ups and downs” in demand. At one point, prices went from $500 per ton to $1,900 per ton (That’s a 380% increase!).
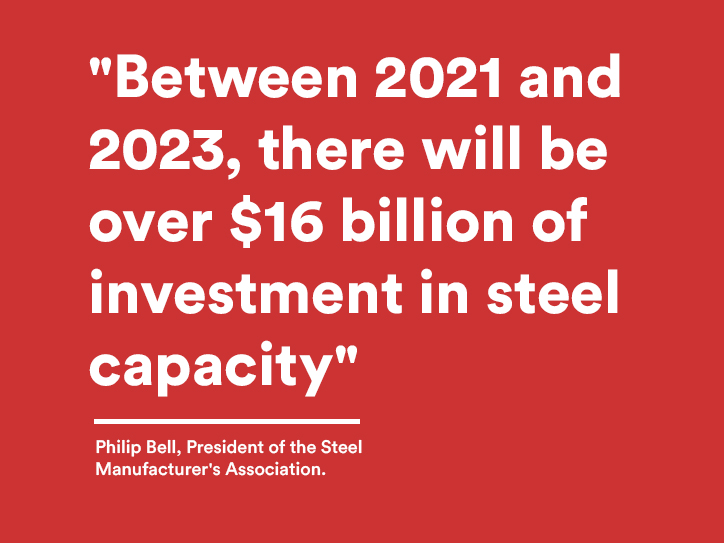
“Between 2021 and 2023, there will be over $16 billion of investment in steel capacity,” stated Philip Bell, President of the Steel Manufacturer’s Association. Contrary to the slow recovery of the European market, the US administration is increasing investment in infrastructure, which benefits steel companies.
The importance of market mapping for the steel industry
Given the current scenario, steel companies need to understand and analyze all their cross-company relationships, from suppliers to distributors. This will help them mitigate the impact of constant changes in demand and allow them to anticipate future operative problems.
You may also like to read: The importance of analyzing cross-company relationships
What’s a market mapping tool?
Market mapping is part of a Big Data solution that uses geolocation analytics, among other elements. It helps understand all the connections between a brand and all the companies inside its business ecosystem.
A steel company can have complex business relations with several private, public, and government entities, some of which directly affect them and others indirectly.
A market mapping tool allows companies to explore uncovered tiers and hidden relationships throughout the supply and production chain. This exploration brings valuable insights that can prevent unforeseen problems, internally and externally.
Case Study: Analyzing one of the biggest US steel companies
We analyzed the cross-company relations of a large integrated steel producer (“S Company” for this sample). The objective is to show you how market mapping tools can provide a better understanding of a complete supply chain, identifying and classifying downstream and upstream operations.
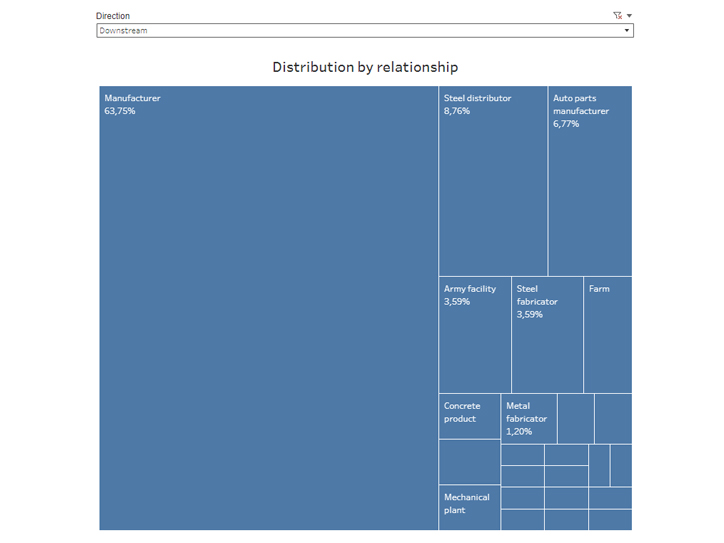
The chart above shows how “S Company” downstream operations are classified.
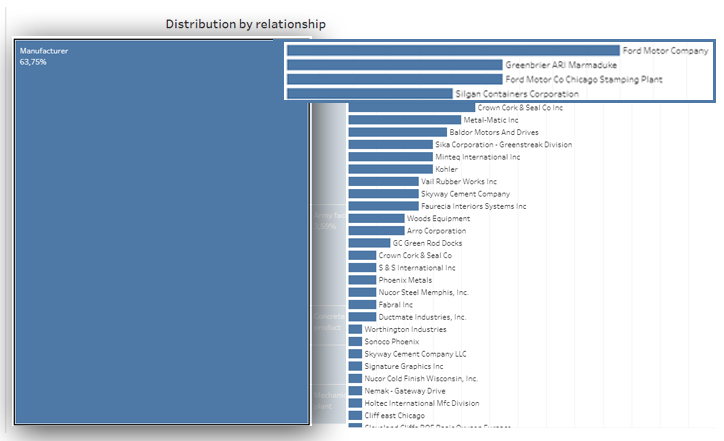
In the chart above data shows strong connections between “S Company” and Ford Motor Company (Automotive), Greenbrier (Transport), and Sligan Containers (Metal Food Packaging).

On the other hand, Kinder Morgan (Energy infrastructure), Steel Warehouse (Steel processor), and Steel Technologies (Steel processor) seem to play an essential role in their “Steel distributor” category.
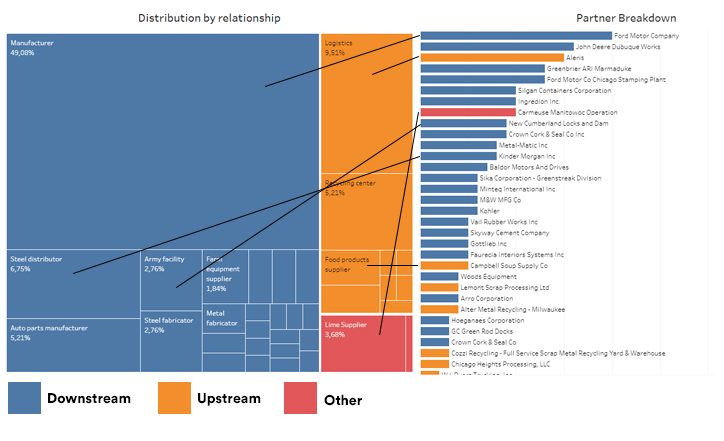
Market mapping tools bring a relation breakdown list to see which companies have tighter connections with “S Company.”
Questions that can be answered with these insights
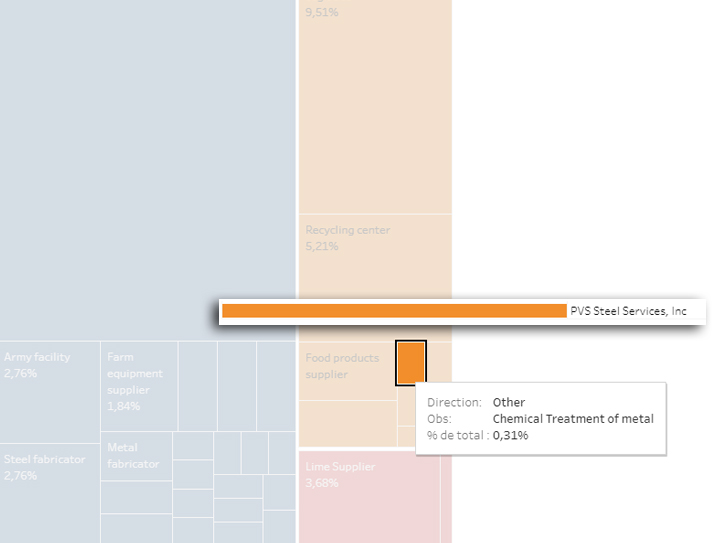
As you can see, market mapping can throw some powerful information that could be difficult to identify using traditional techniques. Consider that some connections can be more difficult to analyze as you explore in-depth your business relations.
These market mapping tools can help answer questions like:
- Which of my first, second, and third-tier suppliers are facing troubles? How does this affect my business? Will this generate critical problems in my operation? Which measures should I take to anticipate future risks?
- What are my weakest and strongest “links” in my supply and operational chain?
- What external and internal factors are affecting my prices and production levels?
- Do I have a conflict of interest within my business environment?
- What’s the best way to classify my different tiers?
Conclusions
Big Data techniques and market mapping tools can give you a competitive advantage in an unstable market that is being affected by different internal and external factors. At PREDIK Data-Driven we follow a very robust methodology that consists on:
- Identify data sources.
- Evaluate and analyze each piece of information from all the entities involved, including private companies, with a geolocation approach.
- Detect and determine patterns between locations and companies, both private and public.
- Classify all tiers within the whole chain, including hidden relations (First, second, third and more).