Micro-mobility analytics improve retailers’ expansion strategies by accurately identifying consumer demographics, understanding customer behavior, and understanding how their competitors are performing.
Micro-mobility is a methodology that combines geospatial data and foot-traffic analytics to solve several problems and improve site selection strategies by helping to understand how people move around specific brick n’ mortar locations, allowing companies to analyze movement patterns around specific locations, such as retail stores, to extract meaningful information.
Business Use Cases
Understand customer demographics
Provides real information about the people who live and travel around specific store locations, gaining insight into customer demographics around an area of interest, where it’s possible to observe what consumers like to buy or visit, building greater trust in a retail location, allowing it to endure over time and have a more reliable sales potential.
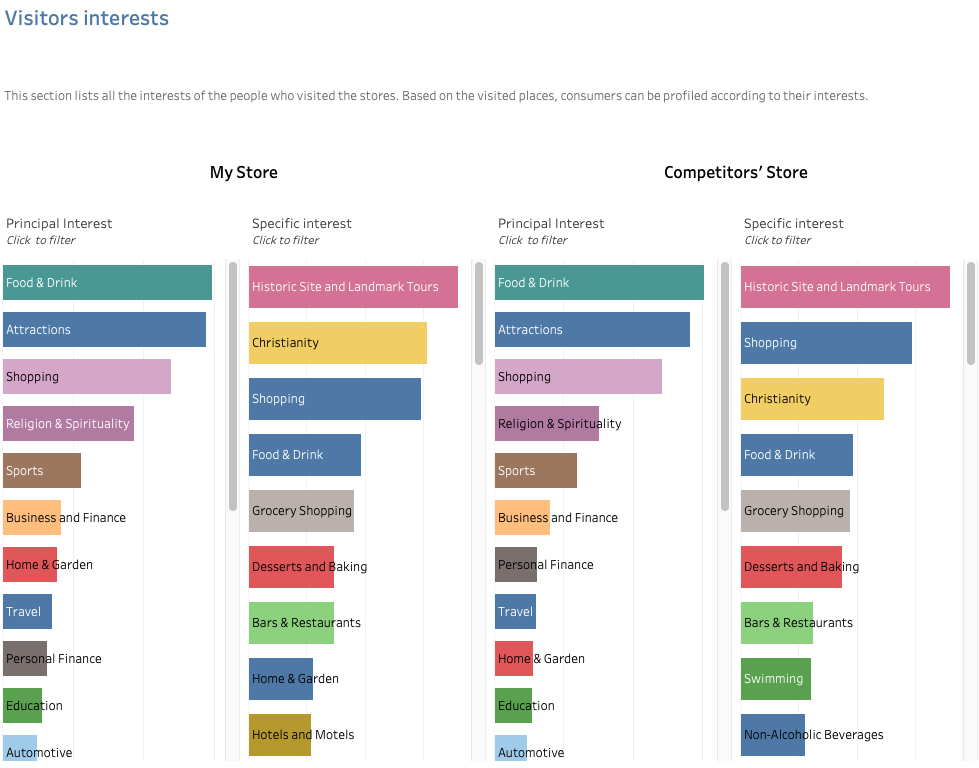
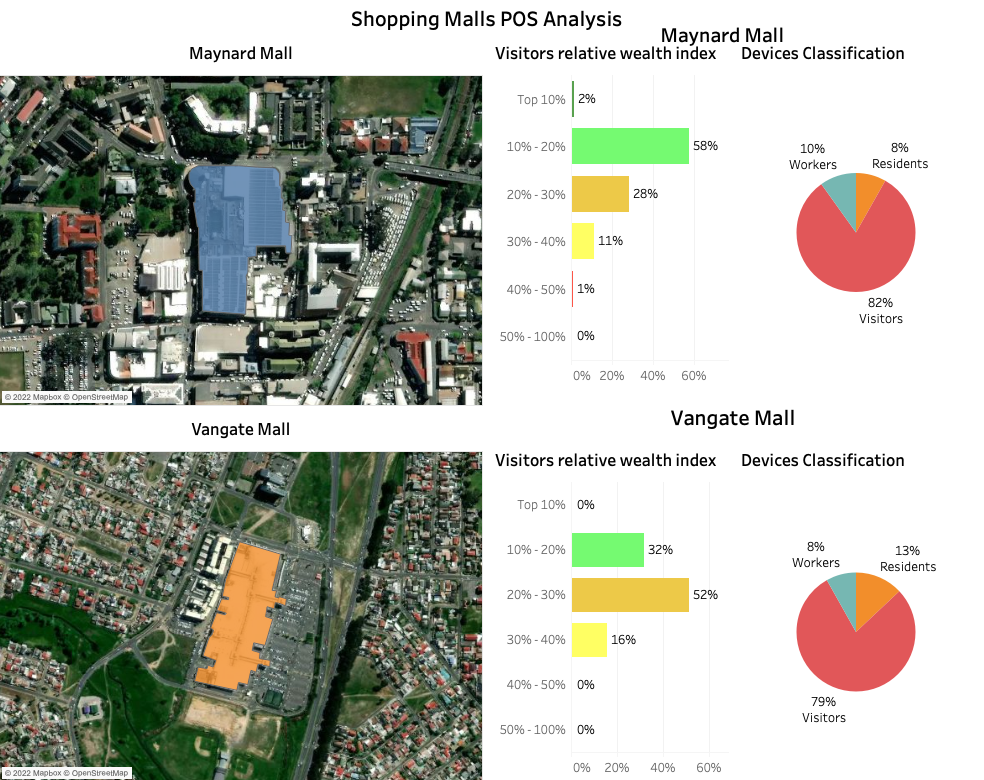
Analyze competitive strength and market opportunity.
Allows you to measure competitors’ market penetration and market share, as well as overall customer loyalty, helping to identify the frequency of shoppers’ store visits.
Real-time tracking of store openings and closings
Provides advanced insight into store opening and closing trends, pinpointing when a brand has moved into or closed in a location before anyone else knows about it. This type of information creates a competitive edge and edge to capitalize on the best available store locations.
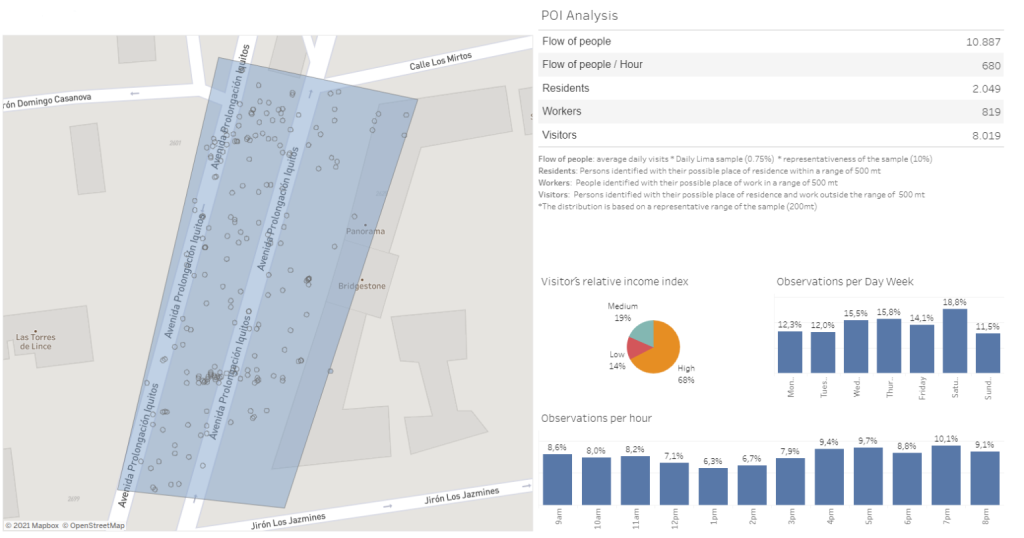
Residents vs. Visitors vs. Workers
Identifies the duration and origin of trips to a given area, differentiating between residents, visitors, and workers, making it possible to develop seasonal forecasts and understand the fluctuation of purchasing power and habits of individuals in a specific area.
Nowcasting and Forecasting
Find trends and generate short-term predictions in real-time, as new information flows.
Foot Traffic
By analyzing potential new locations, you can ensure that there is sufficient existing organic foot traffic for the investment to be justifiable.
Origin and Destination
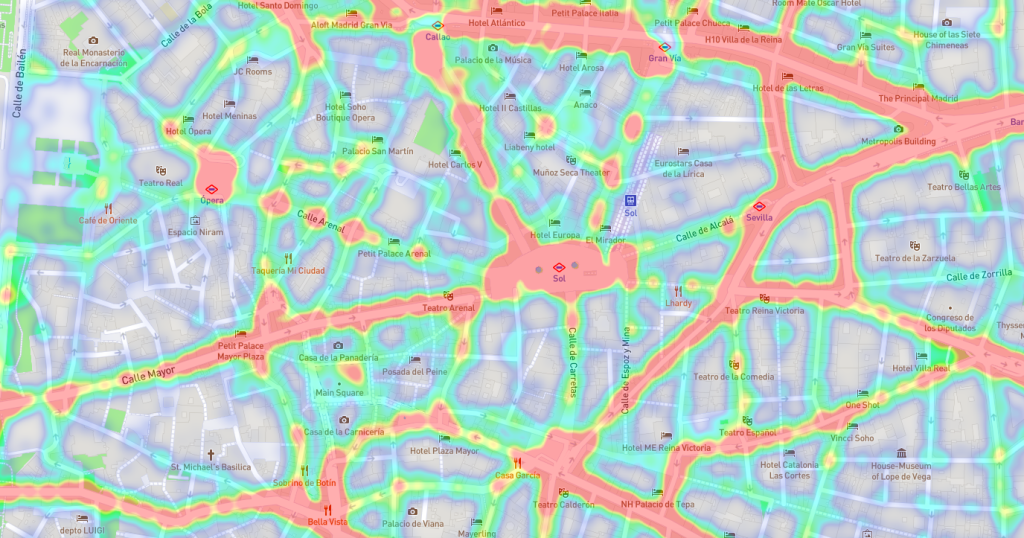
It allows you to know where shoppers’ trips start, where they end and what routes they follow in between. From this, you can deduce who passes through the area, how they travel, and where their trips come from.
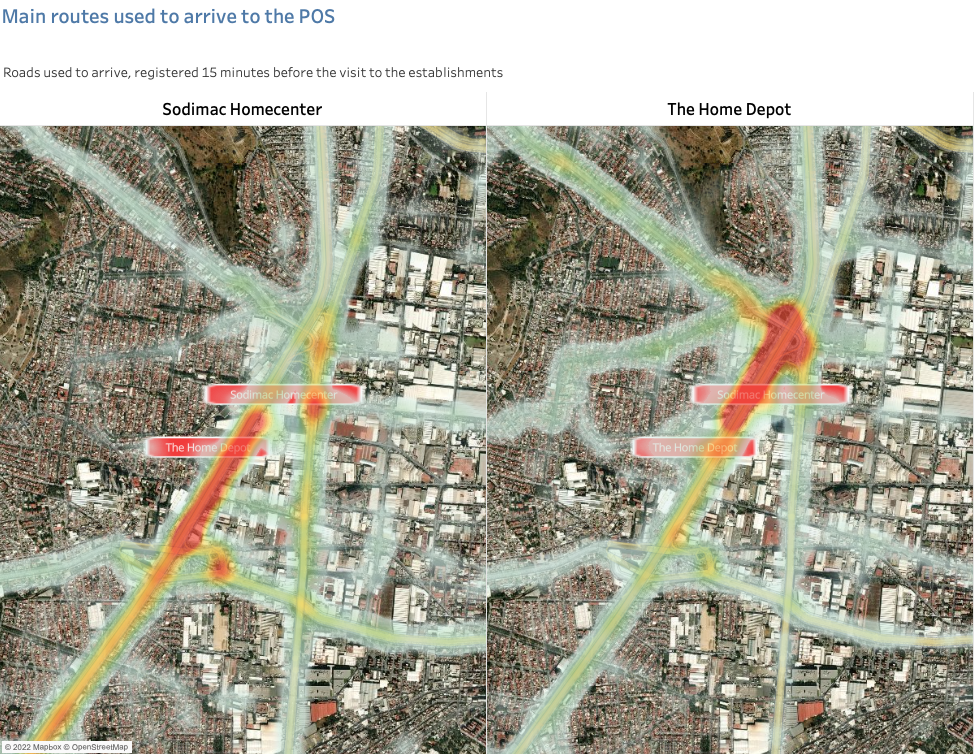
We identified the points of interest and applied a heat map to visualize the mobility patterns of the customers’ trajectory to the points of sale.
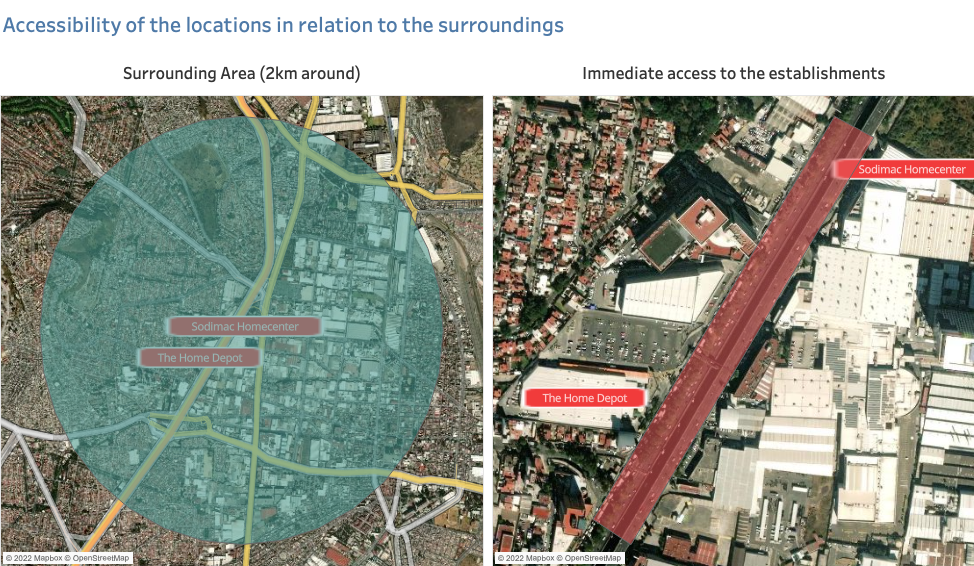
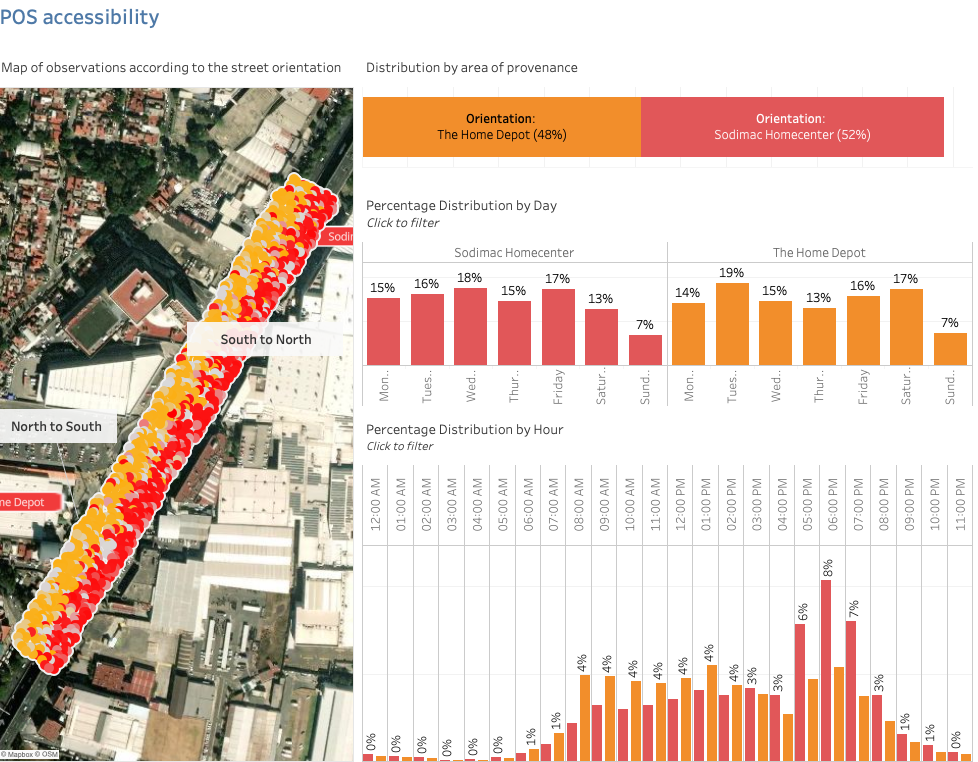
With this, we can also understand the accessibility and how visitors move in the street where the point of sale is located, the mobility according to the day, time of day, and side of the street on which they travel to their destiny.
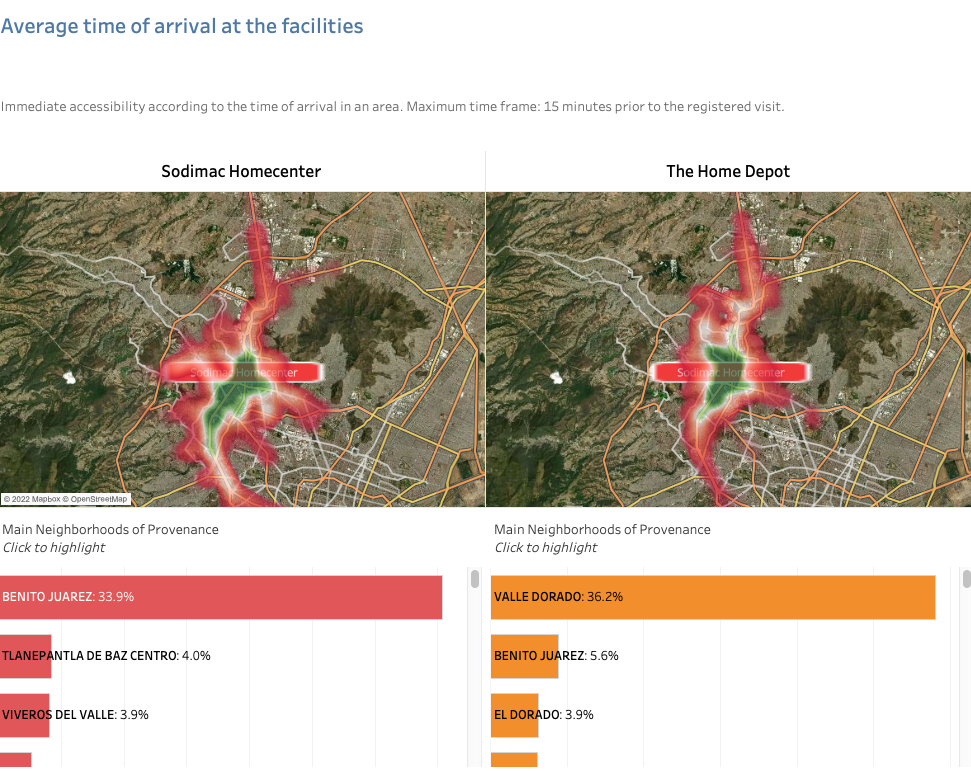
It is also possible to measure and capture in a heat map the immediate accessibility in a given time frame, allowing us to know the average time of arrival of visitors to a point.
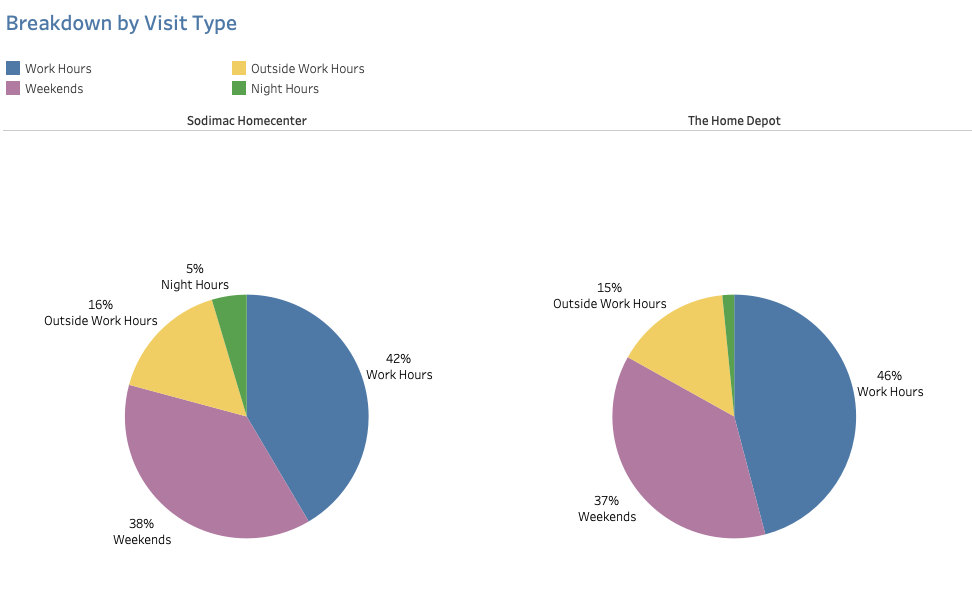
Differentiate the purpose of the visitors
Identify who comes to the point of sale and what is the purpose of their visit, segment visitors and schedules, informing about the protocols of operation of the point of sale.
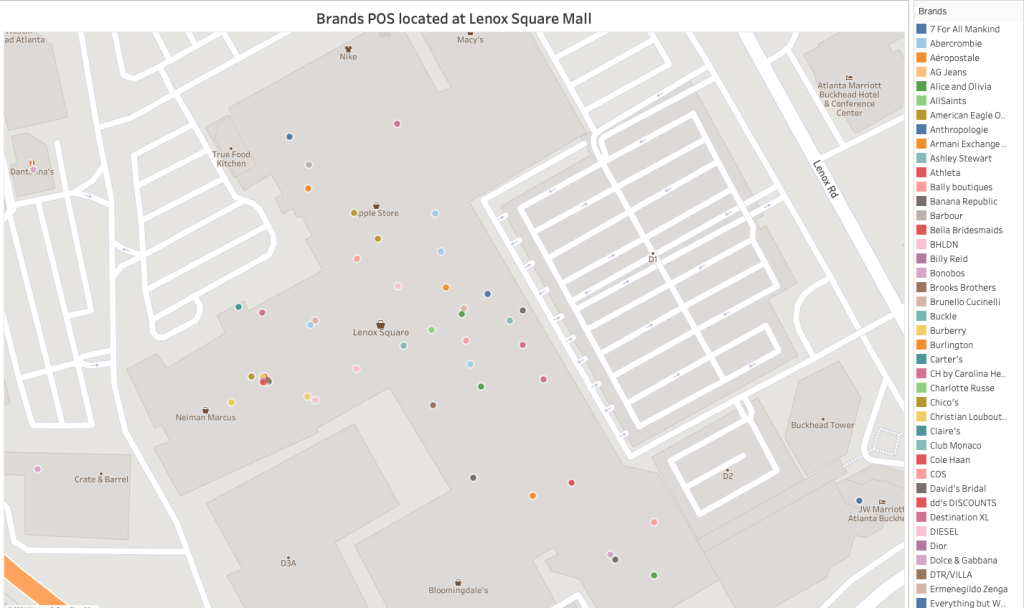
Site self-assessment
Allows understanding where any brands already have a market presence.
With consumer behavior changing faster than ever, retailers can no longer rely on outdated census data to make decisions, especially in the aftermath of a pandemic. Visualize your assets with PREDIK Data-Driven against those of your competitors, ensuring you identify new trends and opportunities before others do.
