Shopping centers were among the most affected by the pandemic. The change in user consumption patterns, the growing competition, the economic uncertainty, and the constant changes in health restrictions by the authorities have generated enormous challenges for entrepreneurs in this area.
Mobility analysis: Vital data for shopping centers
The current scenario highlights the need to understand consumers to generate strategies that reduce risks and maximize income. Did you know that mobility analysis provides keys to making successful decisions for your shopping center?
Mobility analytics allow decision-makers to understand:
• Visitors’ characteristics: What is my visitor’s profile? What stores do they visit? What do they do before and after visiting my shopping center? Where do they come?
• Competition analysis: How many users visit my competitors? What kind of consumers do they have, and what is their behavior? What are their more successful stores?
• New opportunities: Do I have the right offer? What does my shopping center needs? What kind of stores work and which do not?
• The surrounding environment of the property: What kind of users pass through my shopping mall? What day and what time has more influx? What are the characteristics of the property area? Are my access roads correct?
Case study: Comparison between Artz and Antara (Shopping centers in Mexico City)
To best present the benefits of a mobility analysis, we conducted a comparative study between two of the biggest shopping centers in Mexico City: Artz and Antara.
Six success keys you can find in this study:
- Property distribution compared to heat map movement.
- Volume and distribution of visitors.
- Visitors’ analysis (vs. my competition).
- Access roads to the shopping center.
- Socioeconomic profile and visitor preferences.
- What other places did users visit?
1. Property distribution compared to heat map movement
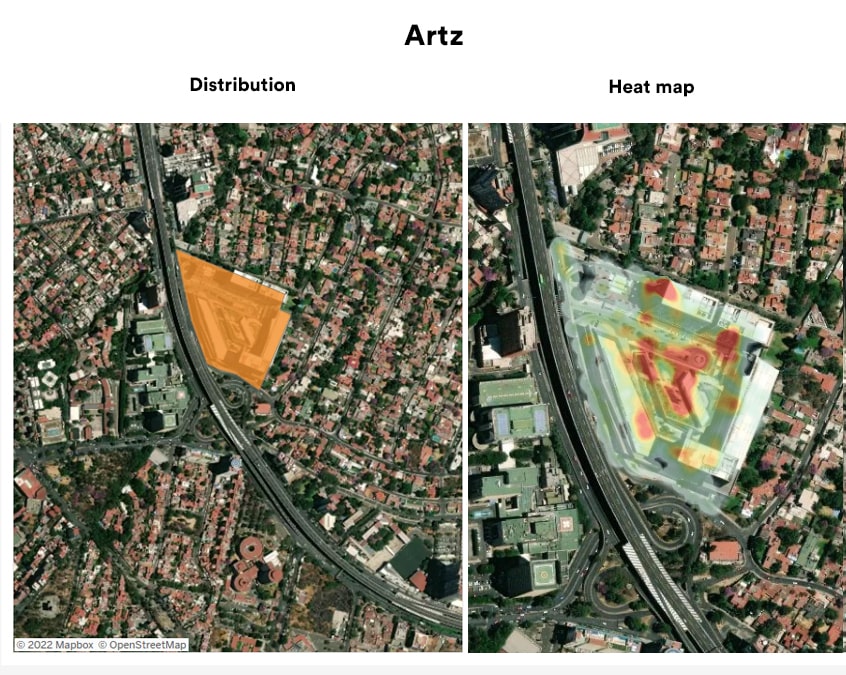
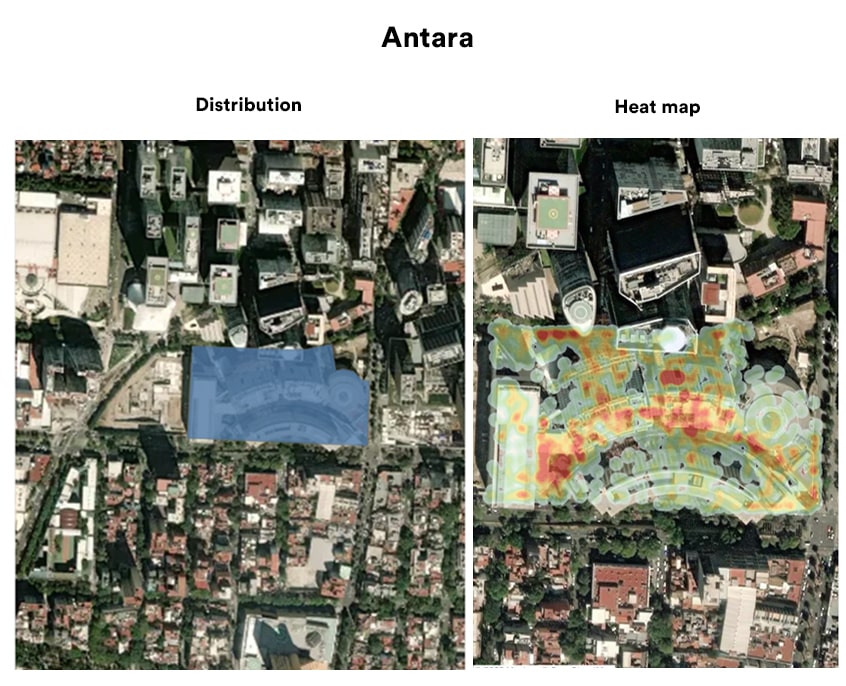
The first key to success is: Analyze how appropriate my visitor’s flow is, considering the areas of significant concentration. The distribution of a shopping center compared to the visitor’s movement within the place allows us to understand which areas have the largest concentrations of users.
In the image, we can see that both shopping centers have very distinctive concentration areas. This information helps analyze, for example, how being inside and outside a “hot area” affects stores. It also allows us to understand if these concentration zones are related to anchor stores, access points, available services, or food areas.
2. Volume and distribution of visitors
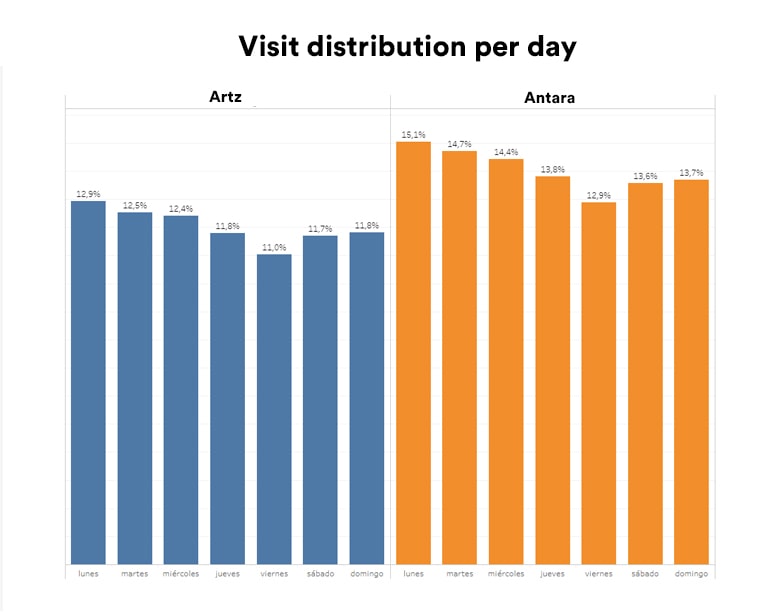
It is necessary to understand my visitors’ volume and daily distribution (It is also essential to compare it with my competition). The graph shows that, although both shopping centers have a balanced influx every day of the week, Antara projects a higher volume of visits.
Comparing this graph with the visitor’s profile can provide valuable information. For example: If a shopping center has a higher volume of visitors with a family profile on the weekend, it could place games, carry out activities for children, increase security or maintain a better flow in the parking areas on those days.
In another example, if Mondays have a low visitor influx, could implement special promotions on that day to attract more visitors.
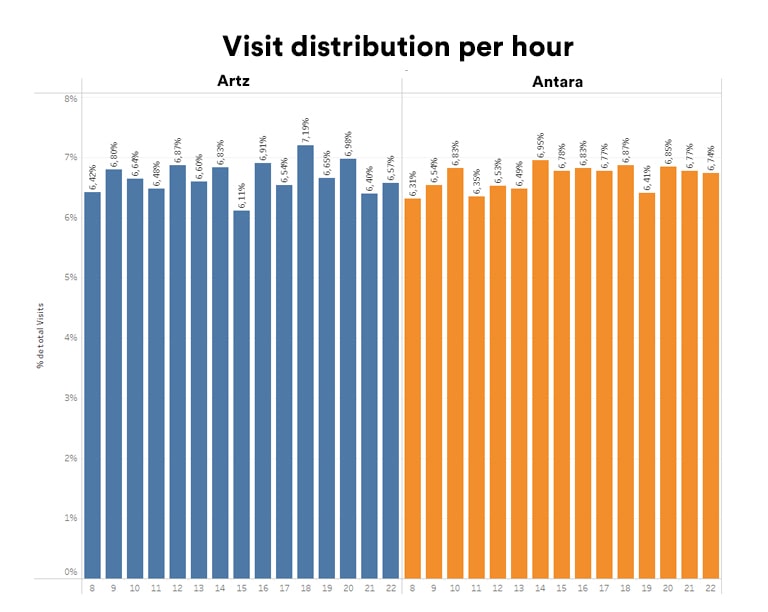
As we can see in the graphic, a large volume of users visit both shopping centers during business hours (approximately 40%). This information may be relevant compared to other graphs.
3. Visitors’ analysis (vs. my competition)
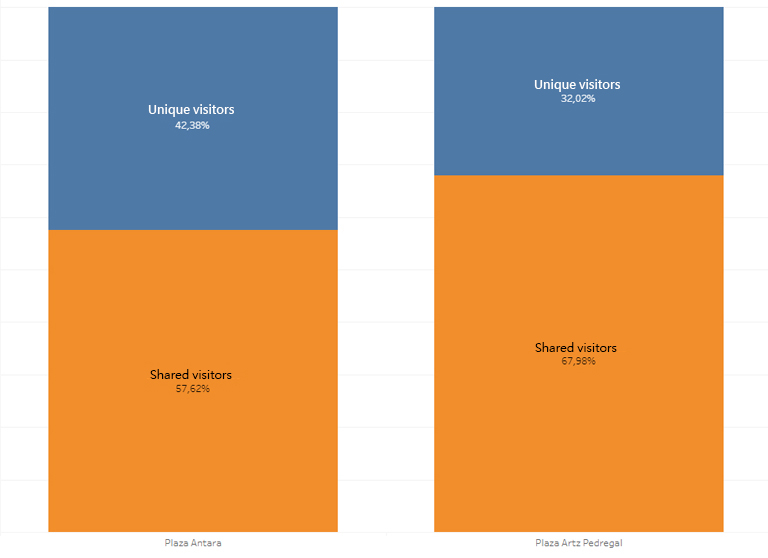
Mobility analyzes allow us to check whether visitors to my shopping center also go to the competition or only to me in a given period. For example, the graph shows that both shopping centers share a significant percentage of visitors.
For both Artz and Antara, the questions can be:
• What kind of stores do my unique users visit that my competition doesn’t have?
• What kind of stores do my shared users visit? Are they the same ones that visit with my competition?
• Who provides a better experience for shared users? My competition or me?
4. Access roads to the shopping center
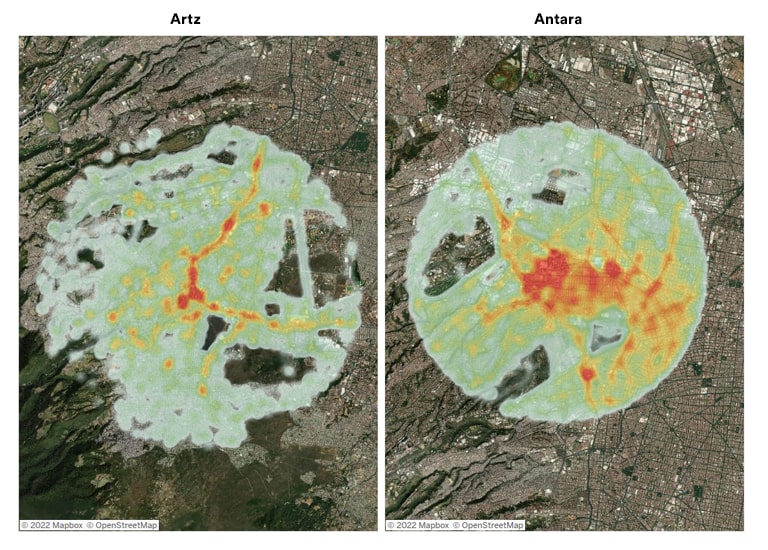
Mobility analysis can show us the access routes that connect with my target market. Understanding what type of user has better access to my shopping center is relevant for defining which offer is the most appropriate.
For example: In the graph, we can see that Antara has more access roads from different parts of the city.
You may also like to read: How To Drive Sales by Measuring Foot Traffic
5. Socioeconomic profile and visitor preferences
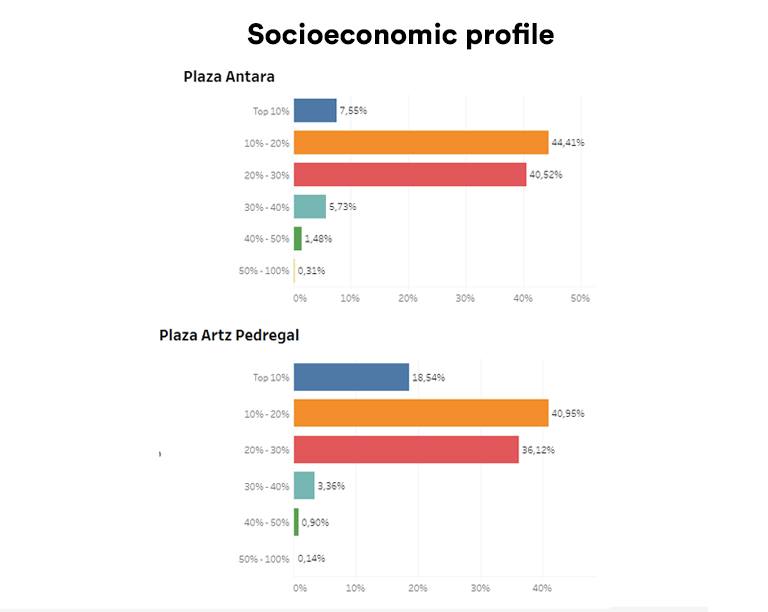
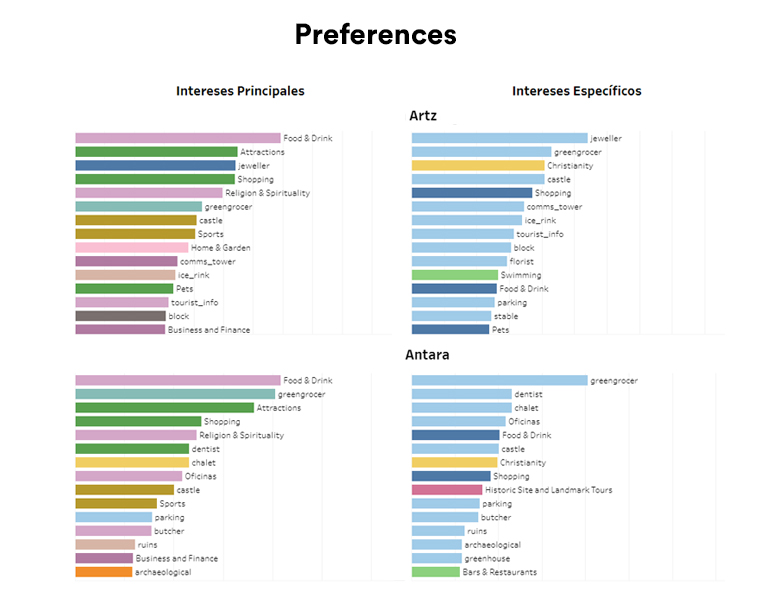
Being clear about aspects such as socioeconomic status and interests of my visitors is important to understand if my offer aligns with the demand. Comparing this information with access routes and visit volume generates compelling conclusions.
The graph allows us to ask and answer questions such as:
• Are the stores in my shopping center the right ones?
• Do I need to have a particular type of store?
• Am I correctly satisfying the demand of my visitors?
In the case of both shopping centers, visitors are particularly interested in “food and beverages” This tells us why a large majority of users pay a visit even during business hours. Both Artz and Antara could analyze: Is my restaurant offer correct?
6. What other places did users visit?
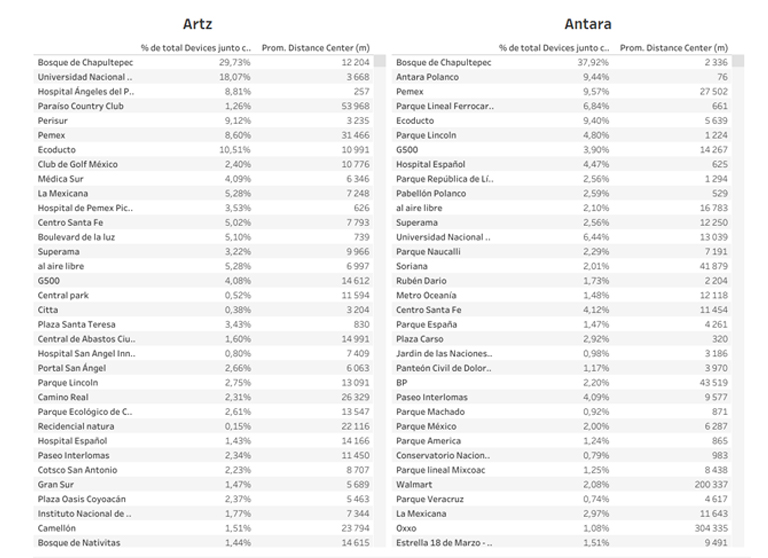
Considering the previous point, reviewing what the visitor does before and after is interesting to understand opportunity points.
For example, in the case of Antara, several users also visited Antara Polanco. What does this tell us? Is there something visitors don’t find in Antara and therefore go to Antara Polanco? (Or vice versa?).
What can we conclude?
Mobility analysis allows us to better understand our visitors and our competition and generate essential information focused on improving current efforts and understanding new points of opportunity. In short, mobility analytics is key to the success of any shopping center.

