By applying POI analytics through spatial data, shopping centers can measure foot traffic and understand consumer behavioral patterns.
Leaders use these techniques to make more efficient and concise decisions that generate greater profitability by maximizing revenue and optimizing costs.
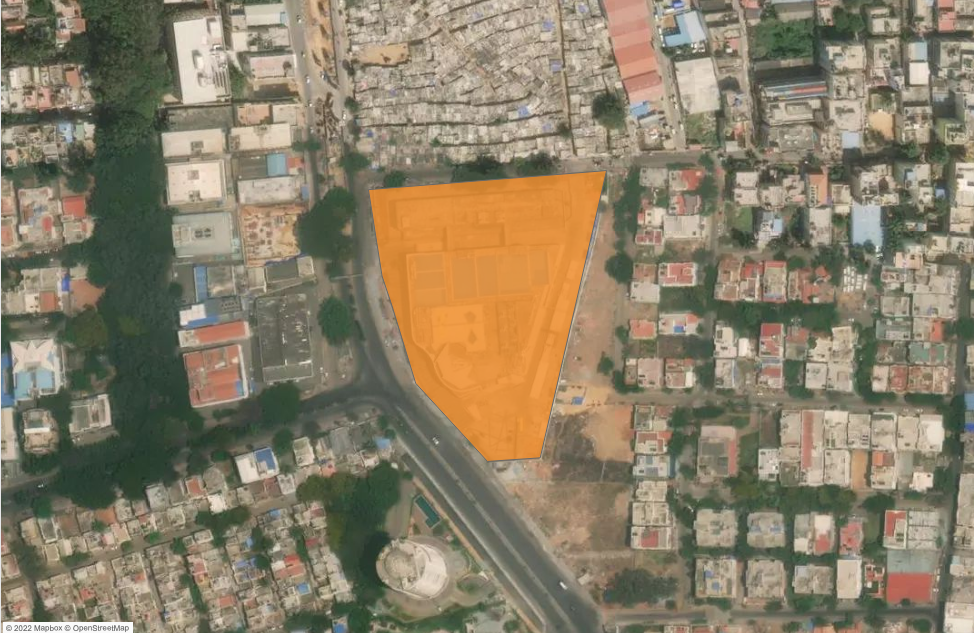
Case Study: POI Analysis of Vega City Mall in Bangalore, India
At PREDIK Data-Driven we conducted a POI analysis of one of the most luxurious shopping malls in Bangalore City, the Vega City Mall, with distinguished brands such as Amazon, H&M, Levi’s, Reebok, Vans «off the wall», Baskin-Robbins, Krispy Kreme, TacoBell.
Through a footfall analysis and POI characterization of the area and people who visited that establishment, we estimated the foot traffic, identified the most and least crowded places, classified the users who visit, live or work in the area, the observations per day, the most and least visited places by customers of the establishment as well as their relative wealth index characteristics.
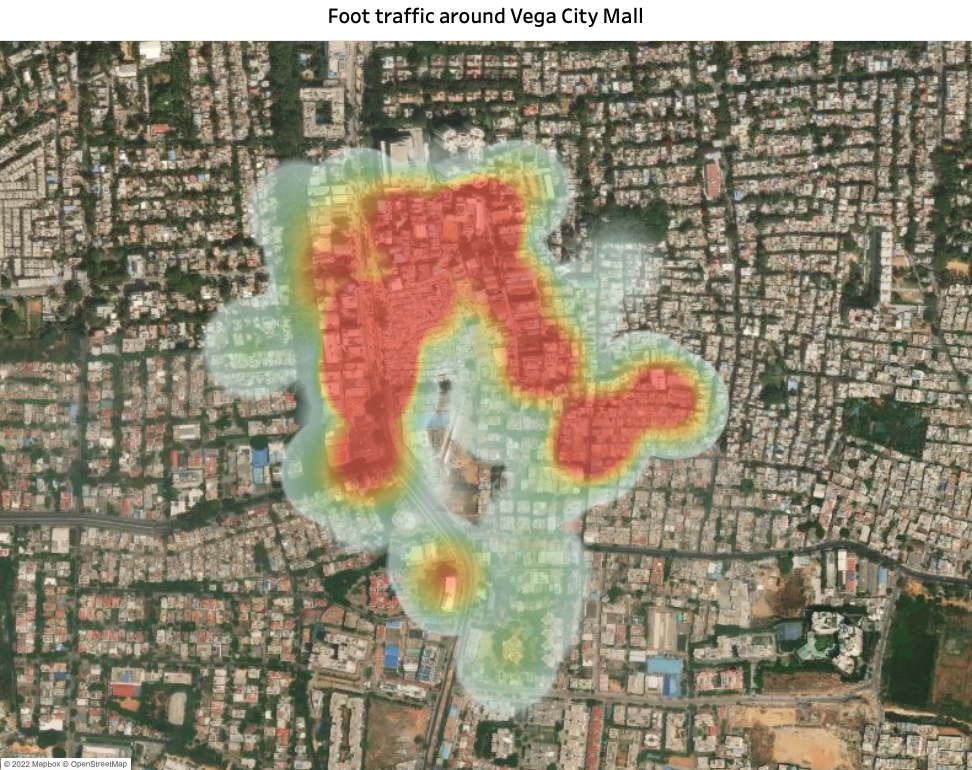
How are visits distributed in the shopping mall?
Through location analytics, the points of interest are identified and a heat map is applied to visualize the in-store mobility patterns of the clients, which allows us to visualize the customer journey, the dispersion of consumers, and the distribution of visits within the establishment.
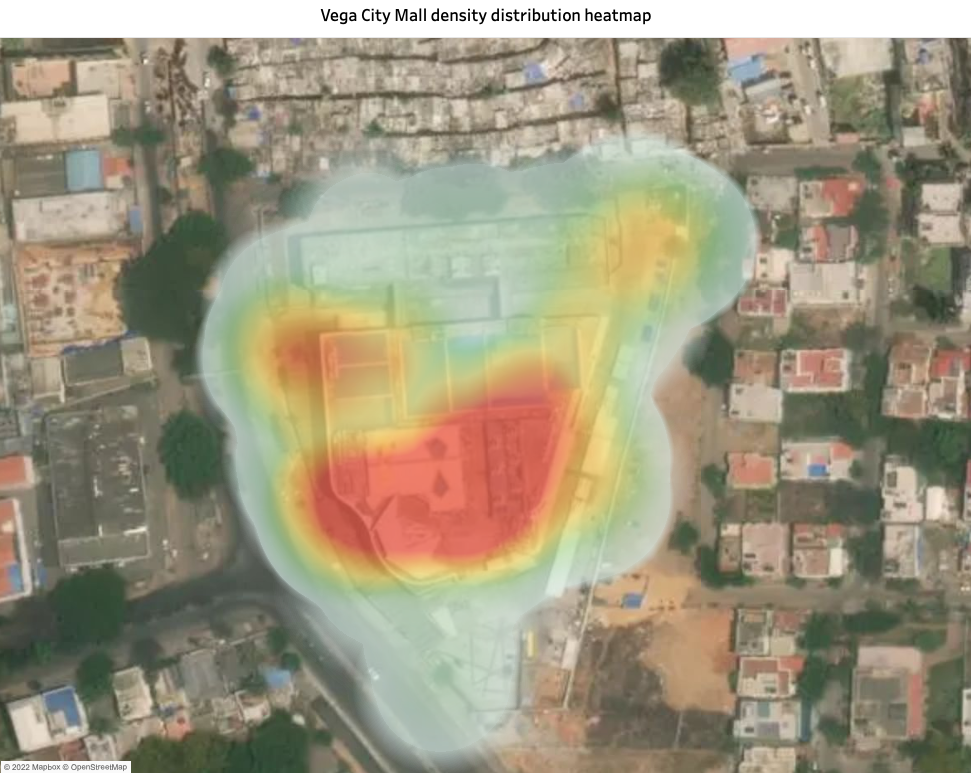
This provides very useful information when conceptualizing the design of the infrastructure and internal architectural plans that make up each establishment so that leaders can implement strategies that improve the customer journey and implement more efficient expansion models while maximizing the shopping experience of consumers.
How are the visits to the facility evolving?
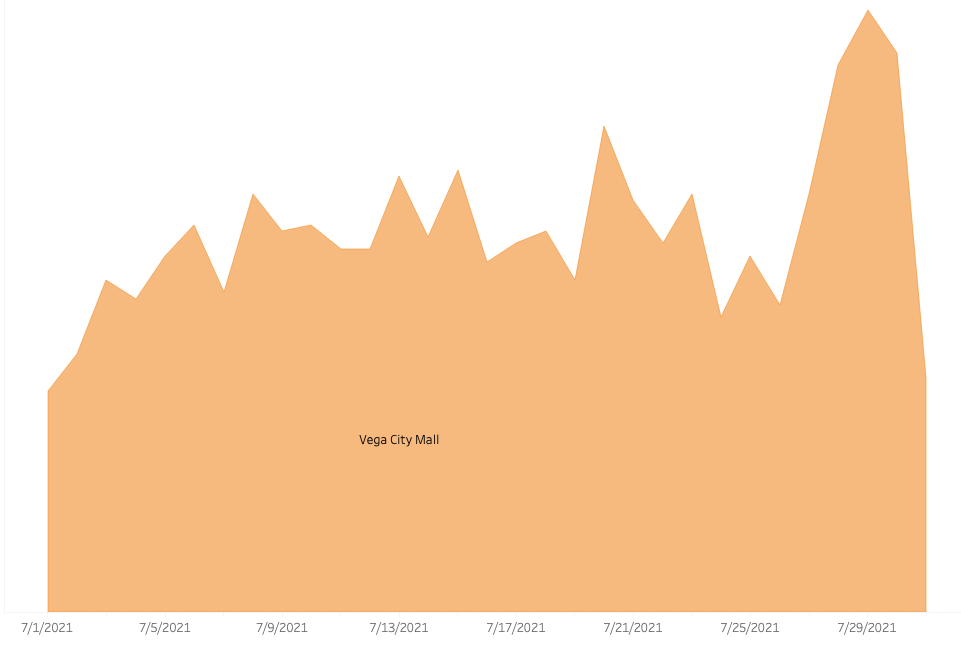
These analyses allowed us to observe the evolution of visits over time, which can be very useful to identify patterns of foot traffic customer behavior and market trends in high and low traffic seasons.
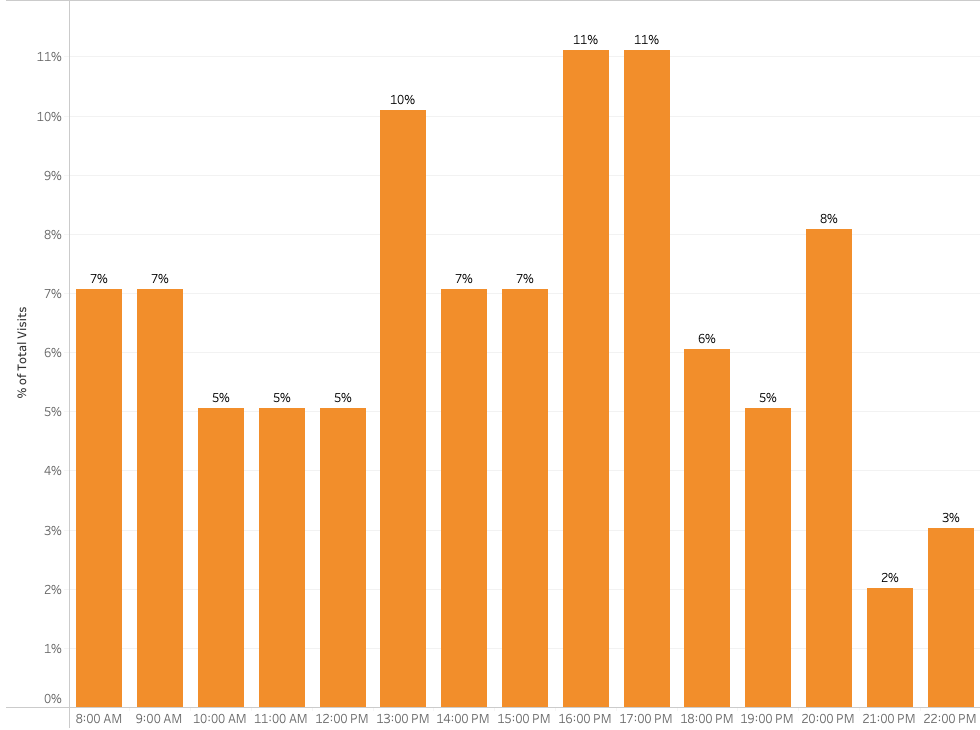
Identify consumer behavior: Which days of the week are the most visited?
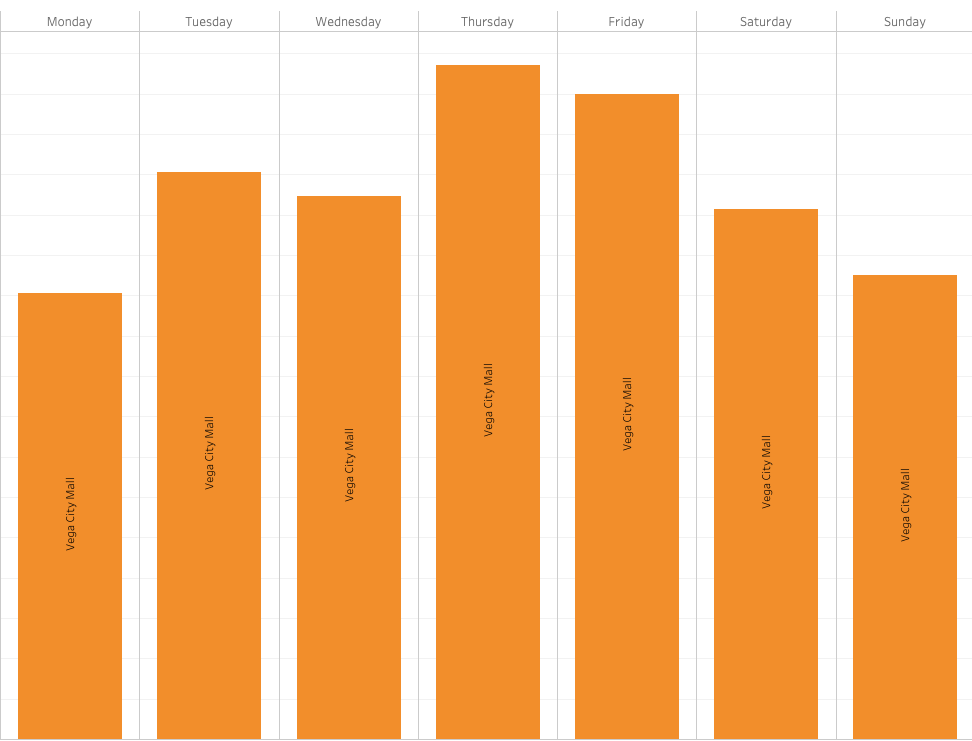
One of the most interesting applications of location intelligence is that it allows gaining detailed knowledge of customers’ behavior patterns by day, hour, month, or year, offering valuable insights to design marketing campaigns and commercial strategies based on the power hours of the shopping mall. This analysis is very useful to know what is the performance of a shopping mall at peak and off-peak hours of the day.
What is the foot traffic mobility pattern around the shopping mall?
Although foot traffic is related to the performance of any retail location, it is not the only key factor for success. Another fundamental aspect to be analyzed is the environment of the establishment, as it allows for comparisons and estimates of the number of visits, revenues, strategic and operational movements of any kind of competition.
By gathering information on the competition’s potential customers, it’s possible to carry out a more detailed benchmarking and generate strategies to capture the competition’s customers.
This analysis of the environment provides us with a detailed picture of the surrounding areas and the mobility patterns of people moving through the area. This data, combined with other factors, provides deep insight into predicting the revenues of any POI.
What other insights can be gained by analyzing footfall at a POI?
By analyzing data over a given period of time at a specific location, it is possible to estimate the percentage distribution of unique and shared visitors of any establishment.
At PREDIK Data-Driven we conducted a detailed study of UB City Mall, the first luxury shopping mall in India, where we found brands such as Burberry, Canali, Coach, Diesel, Emporio Armani, among many others. Read the full article here
Customer profiling
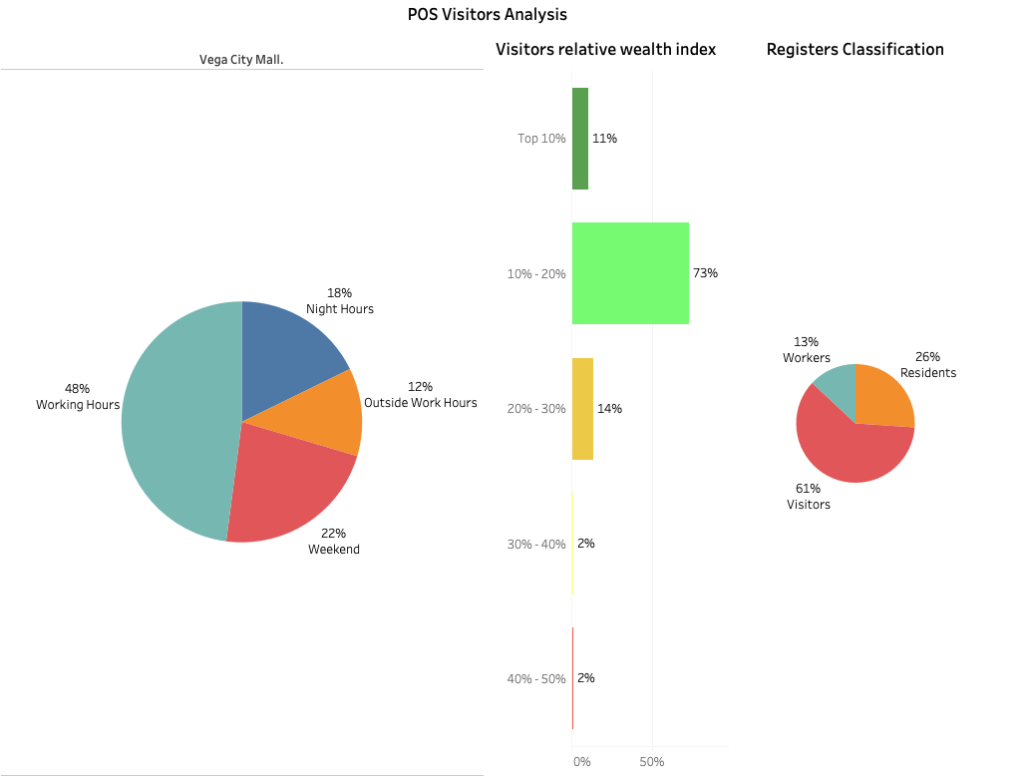
With a Global Relative Wealth Index data layer, collected by Facebook, the socioeconomic levels of the inhabitants and their status were estimated. In parallel, applying spatial data analysis techniques, corporate buildings, residential areas, schools, etc. are located; the combination of these two analyses allows classifying visitors as students, workers, residents, or “floating or instant population”, i.e. people who only transit through that area to reach another location.
What other locations are preferred by Vega City Mall visitors?
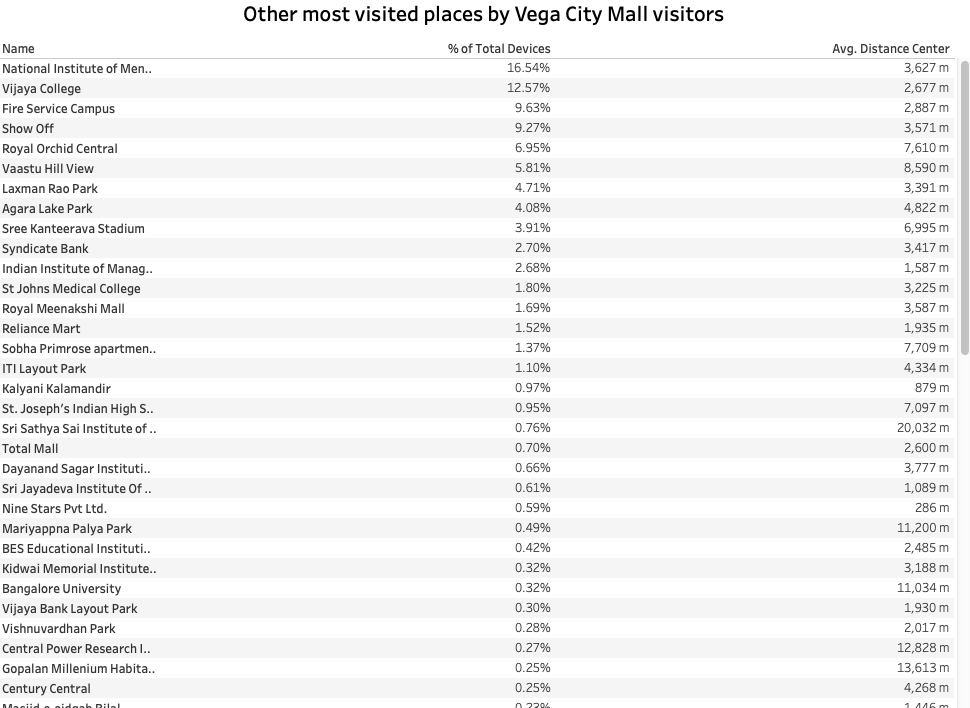
These analyses go into such detail that they allow us to identify and understand visitor behavior patterns and thus observe which are the potential markets, the places that generate the most interest, and the register’s preferences.
