Understanding consumer mobility patterns is critical for all types of businesses. Big Data tools, spatial data, and anonymized and aggregated mobility data play a very important role in these analyses, as they enable the measurement of foot traffic and consumer behavior patterns in any given area or point of interest.
Foot traffic analytics, location intelligence, and point-of-sale categorization have revolutionized the way retailers implement expansion models, commercial and operational strategies in the supermarket franchise focused on more organically sourced products.
Thanks to these analytics, businesses gain a more detailed picture of their store performance, while predicting or estimating brand positioning, customer behavior, market trends, turnover, and expansion strategies, both their own and those of their competitors.
By applying location intelligence analytics through spatial data mining, valuable information is collected, helping businesses to generate several insights related to the number and type of consumers visiting a specific place or area, times of day with more foot traffic, the time spent inside their stores, the count and classification of visits within the stores, the market potential of points of sale or other points of interest (POI) that leaders can use to make faster and smarter decisions that generate greater profitability.
The correlation between pedestrian mobility, visitation, sales, and the success of organic food supermarkets has been studied and proven, so developing this type of analysis has become a priority in the site selection process of any supermarket franchise.
Case Study: Whole Foods Market vs. Sprouts Farmers Market Phoenix, Arizona, U.S.A.
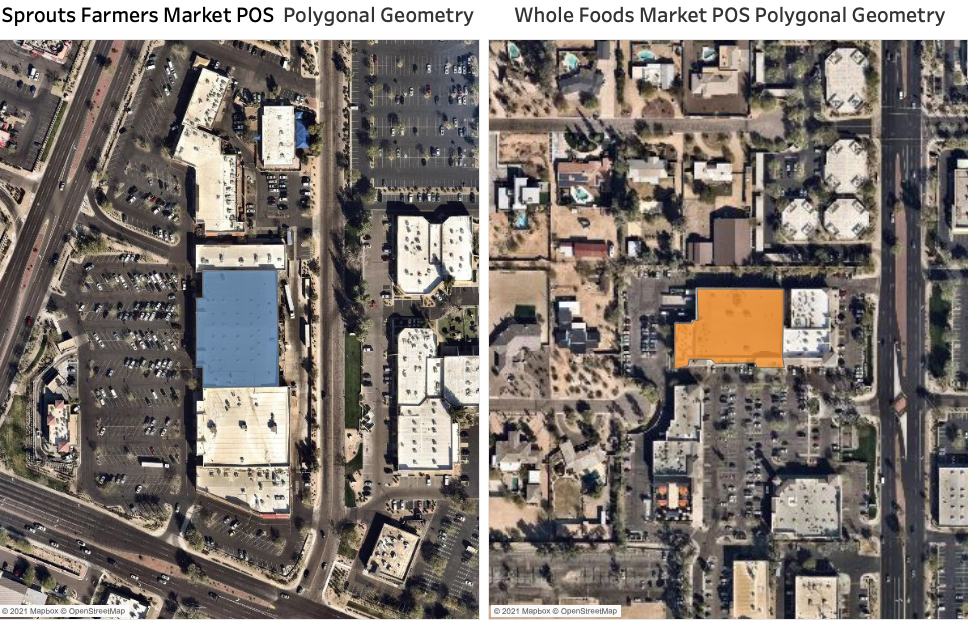
At PREDIK Data-Driven we conducted a detailed study of two organic-focused supermarket franchises in Phoenix, Arizona, Whole Foods Market and Sprout Farmers Market, both located on Tatum Street.
In this case study, we analyzed mobility and foot traffic inside and outside the supermarkets, with the goal of understanding the behavioral patterns of consumers visiting both brands. This analysis aims to answer the following questions:
How are visits distributed in each supermarket?
Through location intelligence, the points of interest are located, then we applied a heatmap visualization based on a mobility analysis to observe the internal distribution, the dispersion of consumer mobility, and the distribution of visits within both supermarkets.
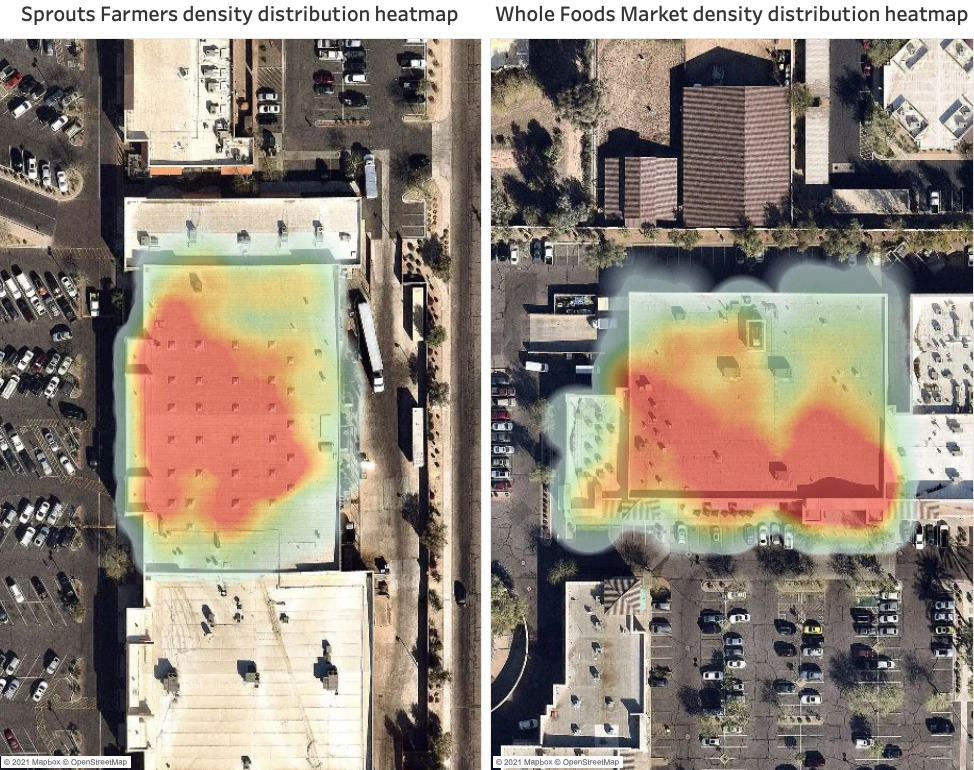
This provides very valuable information when conceptualizing the design of the infrastructure and internal architectural plans that shape each supermarket, helping leaders to implement more efficient expansion model plans.
Which of the supermarkets is the most visited?
Percentage distribution of visits registered between 12/19/2020 and 01/22/2021:
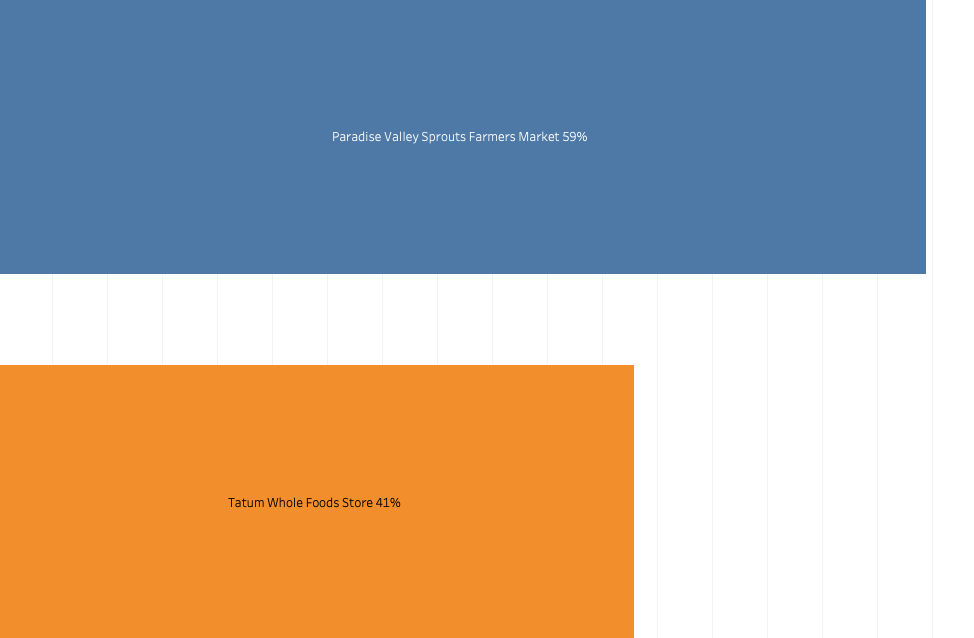
By applying footfall analytics within both supermarkets using the established time period, we identified that 58% of consumers chose to visit Sprouts Farmers Market, while the remaining 41% preferred Whole Foods Market, which correlates with store location and consumer preference when it comes to choosing organic products.
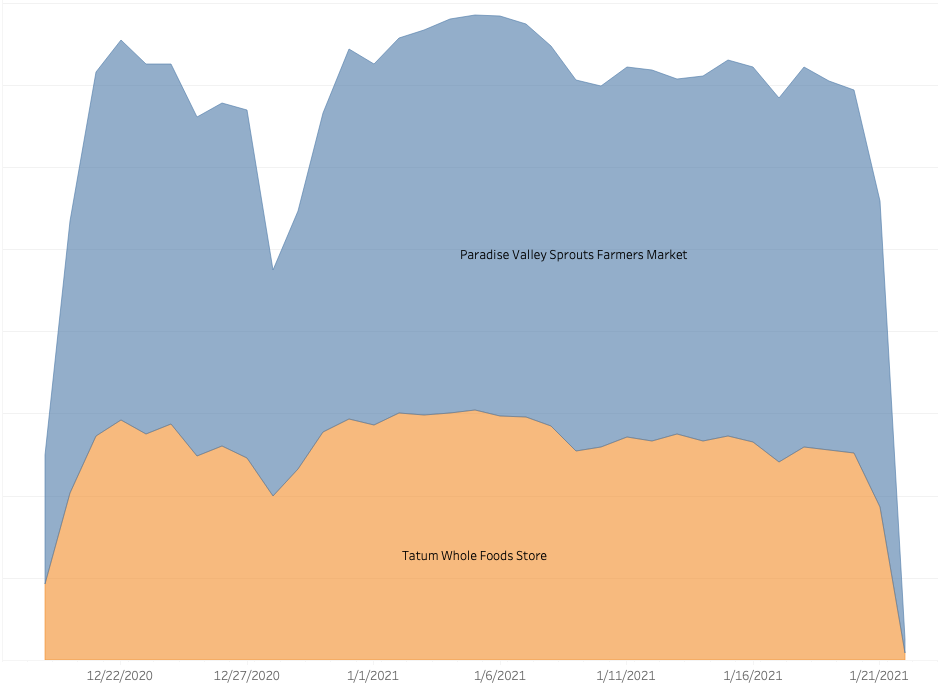
With this, it’s also possible to observe the evolution of visits over time, which can be very useful to identify behavioral patterns of current and potential customers’ behavioral trends.
Identifying customers’ patterns: Which days of the week are the busiest ones?
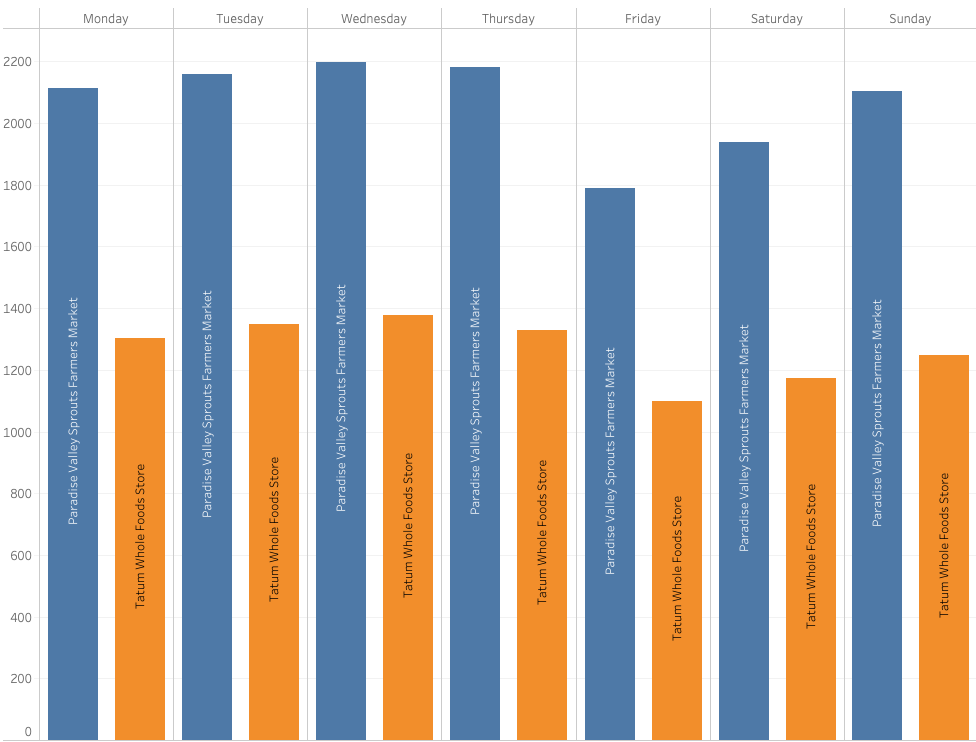
One of the most useful applications of location analytics is that it provides a better understanding of consumer behavior patterns, and offers valuable insights to design marketing campaigns and commercial strategies.
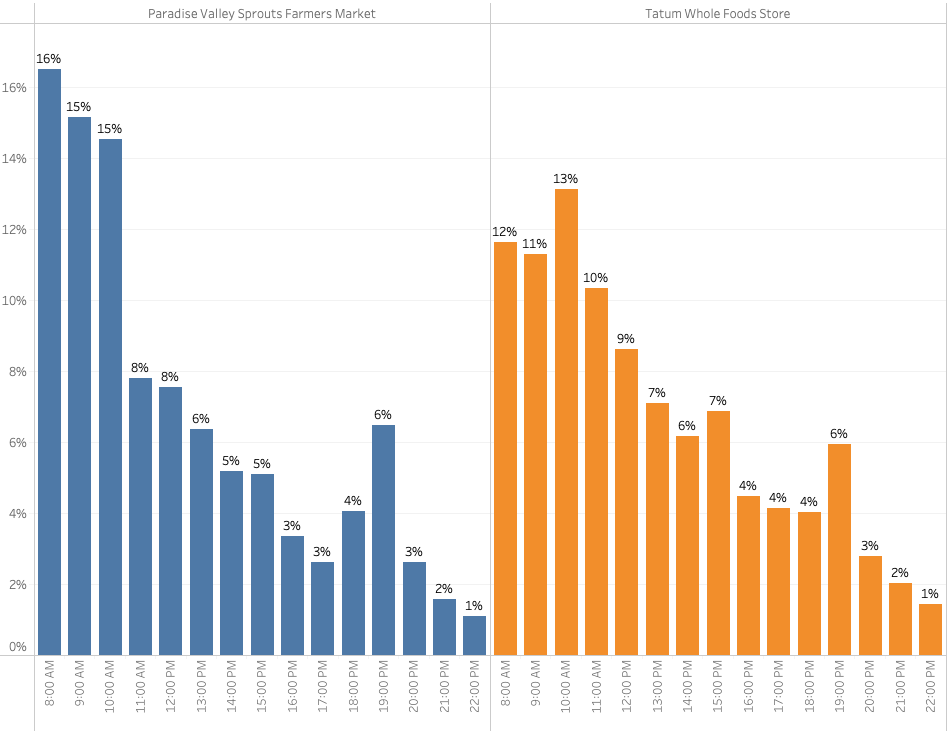
By performing an in-depth analysis of the data, we determined the percentage of the visit per hour. This analysis is very useful to understand the performance of the supermarkets in the busiest hours of the day.
What’s the foot traffic mobility pattern like in the surrounding areas of the supermarkets?
Although visits are correlated with the performance of any location, they’re not the only key factor for success. Another fundamental aspect that must be analyzed is the location’s environment since it allows identifying the competition, understanding its success, estimating the number of visits received, revenues, business strategies, etc.
By gathering information about the competition’s potential customers, it’s possible to perform a more detailed benchmarking and generate strategies that can attract the competition’s customers.
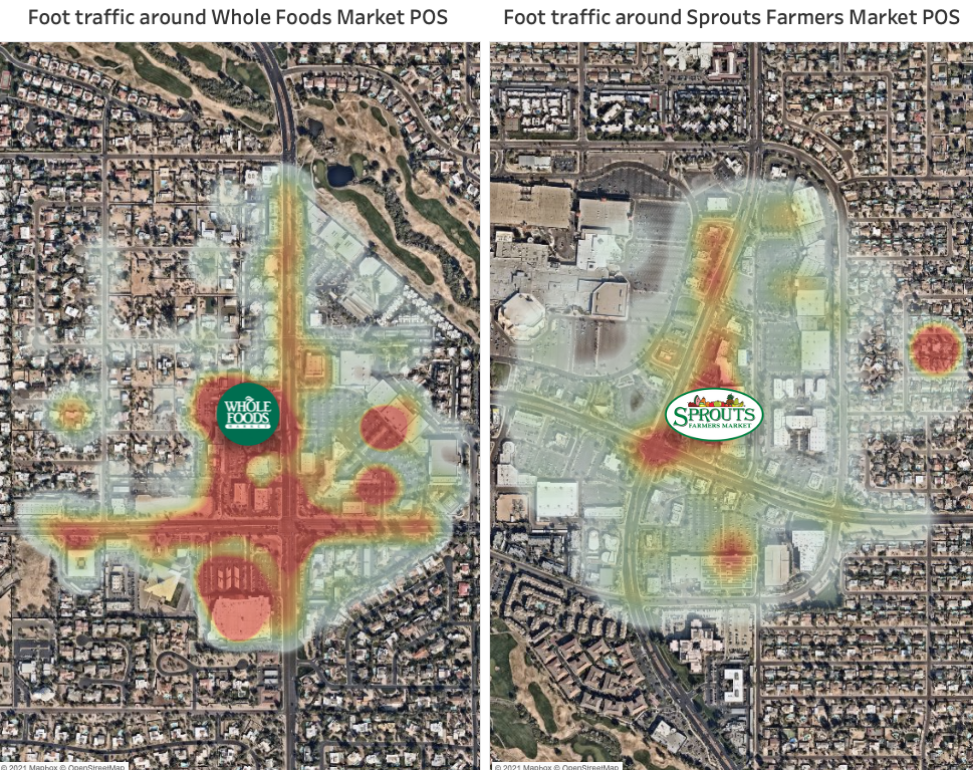
This environmental analysis provides us with a more general picture of the mobility patterns of people moving through the surrounding area. This data, combined with other factors, provides deep insight when forecasting the revenues of any retail establishment.
What other insights can be obtained by applying footfall analytics at a point of sale?
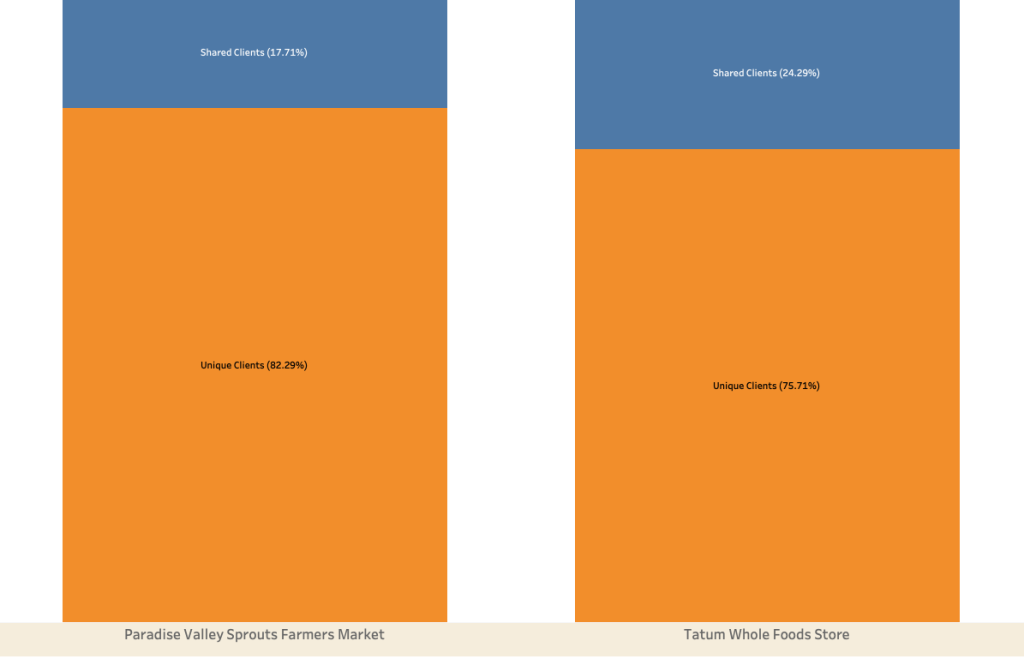
Understand which customers both supermarkets share
By analyzing anonymized and aggregated mobility data over a given period of time at a specific location, such as a supermarket, it’s possible to estimate the percentage distribution of consumers who visited both shopping centers.
These solutions benefit any type of business, an example of this is another case study that was conducted to compare two of the most popular supermarkets in the city of Guadalajara Jalisco, Mexico, the findings were more than interesting. Read more about this case: “Walmart Vs. Soriana: Consumer Foot traffic Analysis“
Customer Analytics
With this analysis, it’s possible to infer in which other places (stores, restaurants, shopping malls, residential areas, among others) the people who were at a point of interest also visited. Thus, Sprout Farmers Market and Whole Foods Market can analyze how their customers behave, since they can look where and how long they were before and after visiting the supermarkets. This allows them to generate high-value insights to optimize the understanding of current consumers and search for new potential customers with similar behaviors.
Identifying ideal areas in expansion and site selection strategies
With mobility data, it’s possible to clearly understand the behavior of the people who pass through a given area, how they’re alike, their tastes, preferences, socioeconomic level, and purchasing potential. Including an in-depth analysis of the commercial establishments in the area in question, becomes a crucial factor in determining the best locations for the opening of new stores.
What is the revenue potential of my competitor?
Through machine learning models, it’s possible to predict the revenue and visits of a competitors´ store. With these models, Sprout Farmers Market could get to estimate the revenue of its competitor Whole Foods Market in a specific week, month, or year. These models can also be used, for instance, to predict the potential success of an outlet that is about to open. This is ideal to complement feasibility studies for new stores in expansion plans.
All these insights are generated by applying location intelligence and mobility analysis, if you are interested in knowing more about these insights, we conducted a POI characterization case study of N1 City
