Success Stories > Boston’s Restaurants
How did Boston's Restaurants find the best locations for its new openings?
Company
Challenges
Solution
Results
In-depth knowledge of the geospatial characteristics of current restaurants and prioritization for opening new ones with high sales potential.

Our client
For two decades, Boston has positioned itself in Mexico through restaurants in 22 cities.
Their idea of having two rooms under one roof, a restaurant and a sports bar, emphasizes quality, service, and atmosphere. Therefore, they prioritize the location as a critical element for the brand’s success and consider several factors when choosing a new restaurant.

The Challenge
The brand needed to validate that its new restaurant locations were optimal.
Whether placing a new restaurant within a mall or in a stand-alone format, the marketing team has precise parameters when selecting a new location.
For this reason, they needed to ensure that the sites they were evaluating had the potential to generate the expected sales results.

Solution
Predictive models to assess the sales potential that their new restaurants could have.
Hand in hand with the marketing team, we evaluated their current restaurants from different perspectives. For example, we estimated mobility patterns in the catchment areas of each establishment, socioeconomic profiles of the people within the area, areas with the highest traffic, among others.
In the image, the size of the circle is proportional to the number of visits. Green represents the largest number of visitors from that area.

The graph compares pedestrian influx in different catchment areas around the selected point of interest (POI). Green indicates the lowest areas of population concentration, and red indicates the highest.
This analysis was complemented with information on internal sales and other brand’s KPIs. Through all this data, we developed a Machine Learning model able to find the key variables that positively or negatively influence the performance of a brand´s restaurant.
The model can evaluate whether the new locations found by Boston’s marketing team have the potential to generate good results in the future.
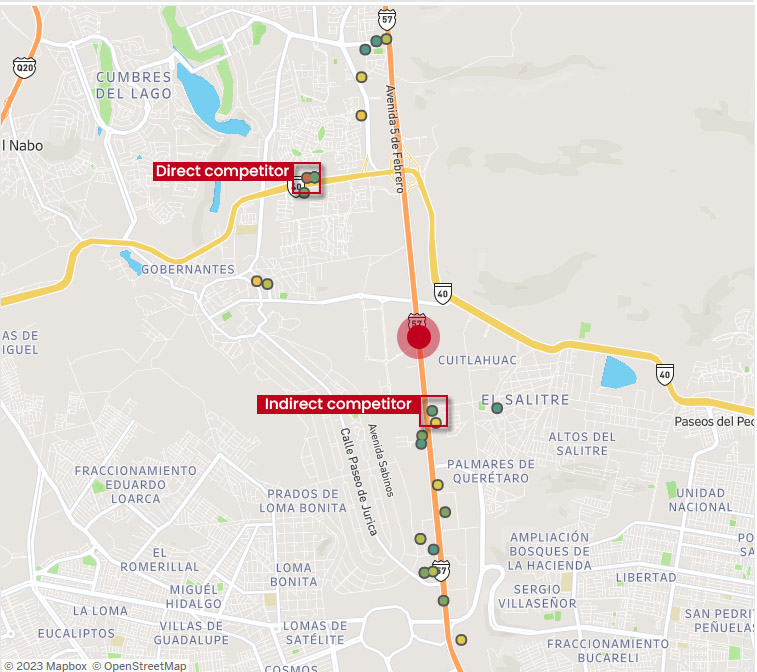
The image shows the competitors within a five to 10-minute radius of one of the brand’s restaurants.
The red circles imply a higher rating, while the green ones are the lowest.
“With PREDIK Data-Driven we found a reliable, accessible and easy methodology
to evaluate locations for our developments. We have opened two and the results are in line with expectations.
Marketing Director, Boston´s Restaurants Mexico

Results
Confirmation of new locations with high potential for success.
Currently, the brand has used our model to place two new locations and evaluate the performance of its current restaurants.
Find out what Big Data Analytics can do for your company
Schedule a 30-minute meeting with one of our data experts to understand how can we work together and develop the perfect Big Data solutions for your organization.
Our solutions have helped some of the most important corporations in the US, Europe, Latin America, and Asia Pacific.