Footfall analytics based on Big Data techniques allow businesses to understand a point of interest and with it, implement strategies, expansion strategy models and solutions within retail and wholesale markets, helping leaders to make better decisions based on mobility patterns.
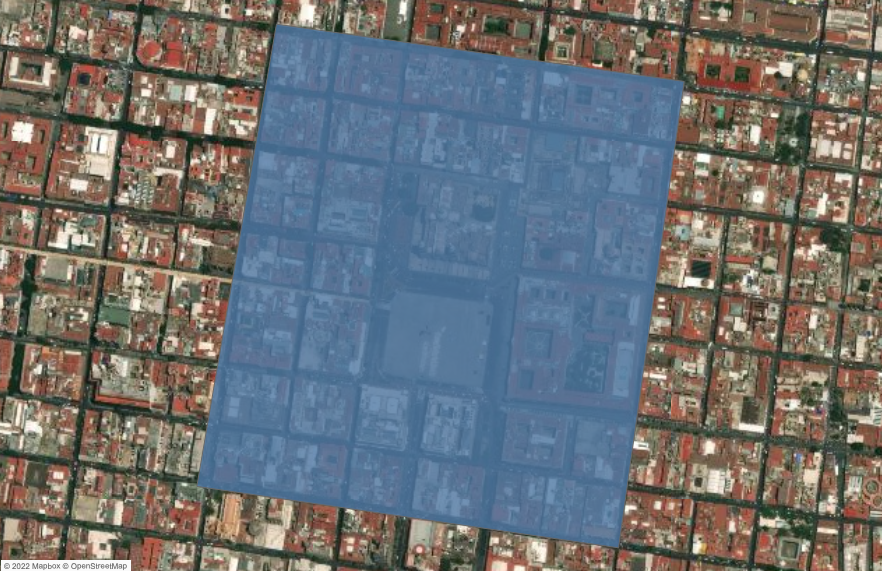
At PREDIK Data-Driven we conducted a detailed study of La Plaza de la Constitución, informally known as El Zócalo, is the main square of Mexico City. Together with the surrounding streets, it occupies an almost rectangular area of approximately 46 800 m² (195 m x 240 m). It was named after the Constitution of Cadiz promulgated in 1812. This is the second largest square in the world and the first among hispanic countries.
In this case study we analyze the mobility and footfall within the point of interest, in order to understand the behavioral patterns of people visiting the area in December 2020. This analysis aims to answer the following questions:
How are the visits distributed in the historic center and its surroundings?
Through location intelligence, the point of interest was identified and a heat map was applied based on the mobility patterns of the visits, which allows us to observe the dispersion of visitors and the concentrations of foot traffic within the established geofence.
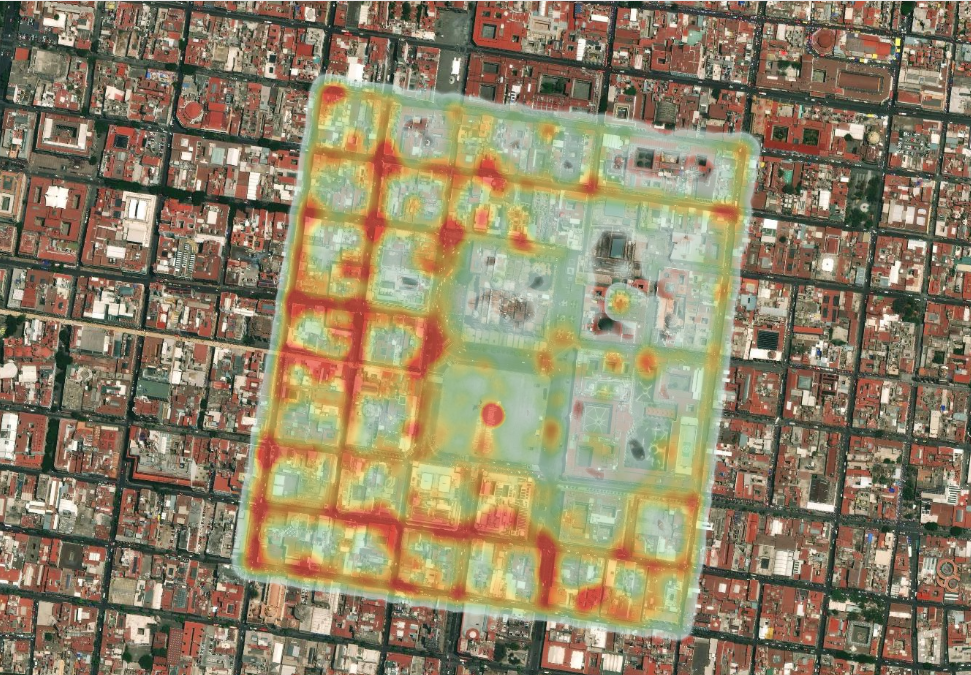
This offers very useful information when conceptualizing the mobility of any point of interest, helping leaders to implement strategies that improve the customer journey and implement more efficient expansion strategies, maximizing the shopping experience of consumers.
This analysis of the environment provides us with a more general picture of the surrounding areas and the mobility patterns of people. This data, combined with other factors, provides deep insight into predicting the revenues of any retail establishment or point of interest.
What was the evolution of visits to the point of interest during the month of December 2020?
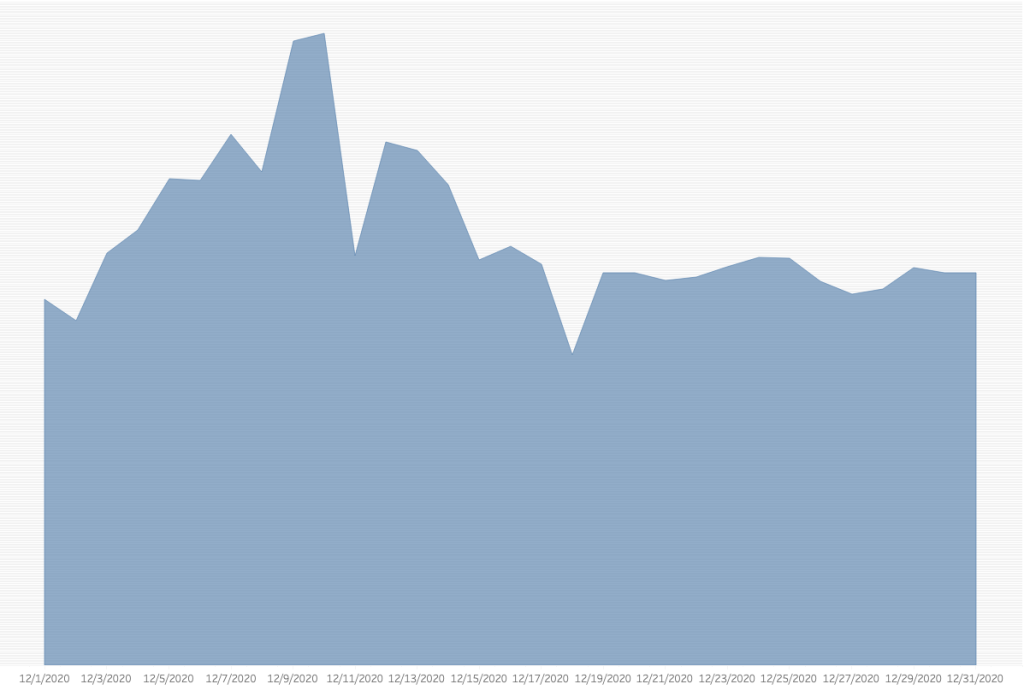
These analyses allow businesses to observe the evolution of visits over time, which can be very useful to identify patterns of foot traffic customer behavior and market trends in high and low traffic seasons.
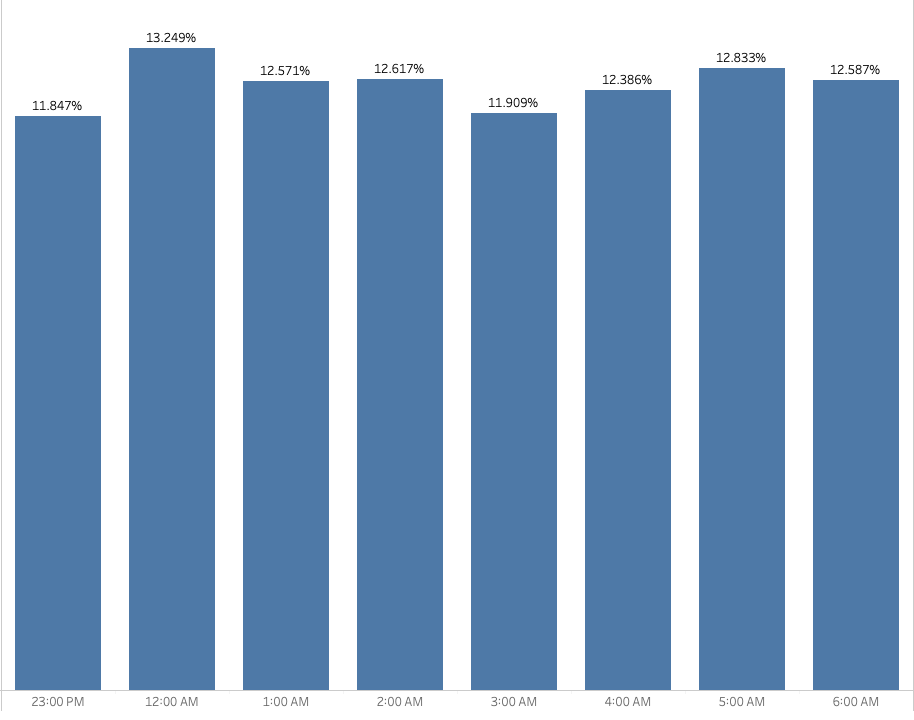
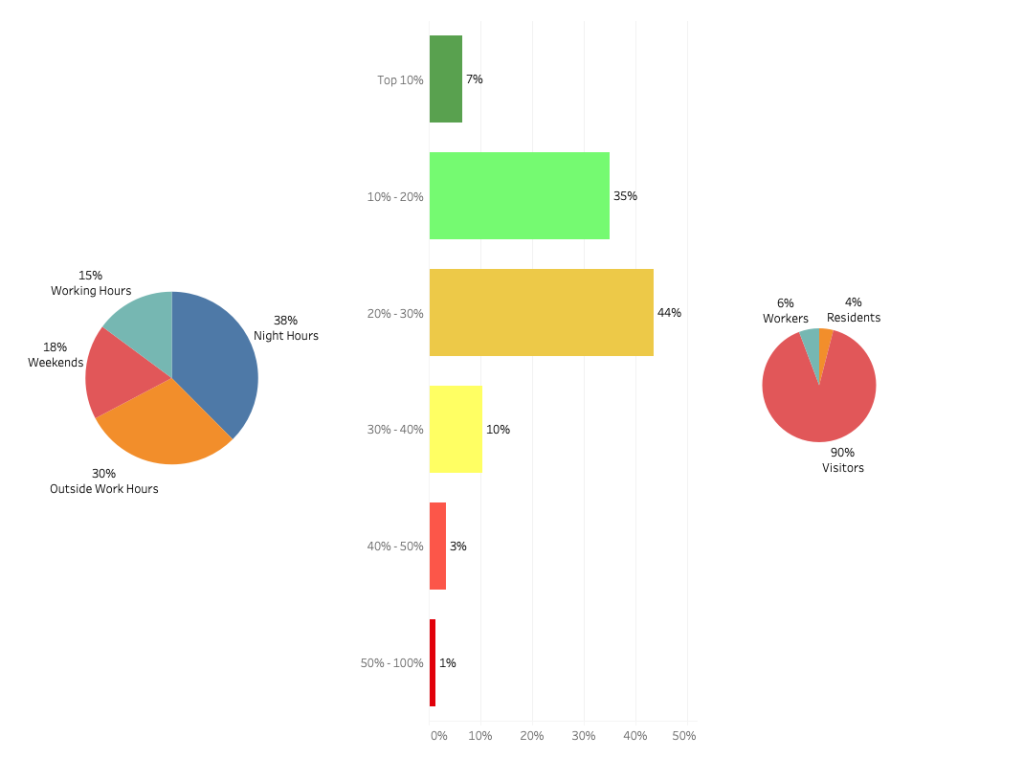
Identify consumer behavior: Which days of the week are the most visited?
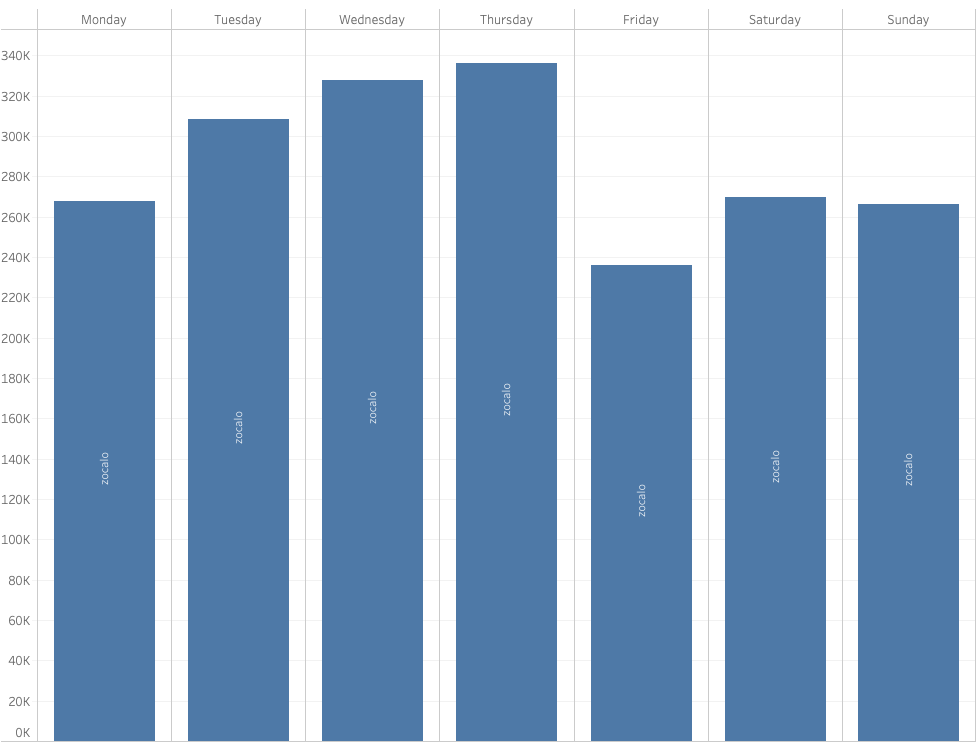
One of the most interesting applications of location intelligence is that it allows gaining detailed knowledge of customers’ behavior patterns by day, hour, month, or year, offering valuable insights to design marketing campaigns and commercial strategies based on the power hours of a POI.
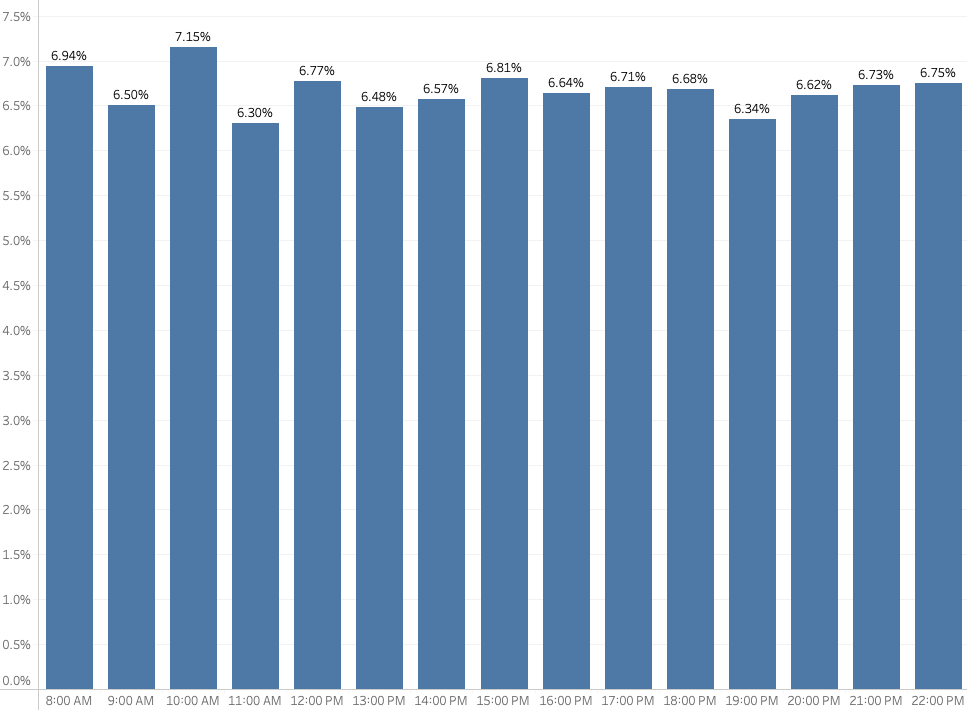
This analysis is very useful to know what is the performance of the stores at peak and off-peak hours of the day.
Note: These insights can be enriched by using data from the establishments themselves and a broader period of geospatial data, for this analysis only one month’s data was used, so the analysis is not as accurate as it could be once using more data sources and different time periods.
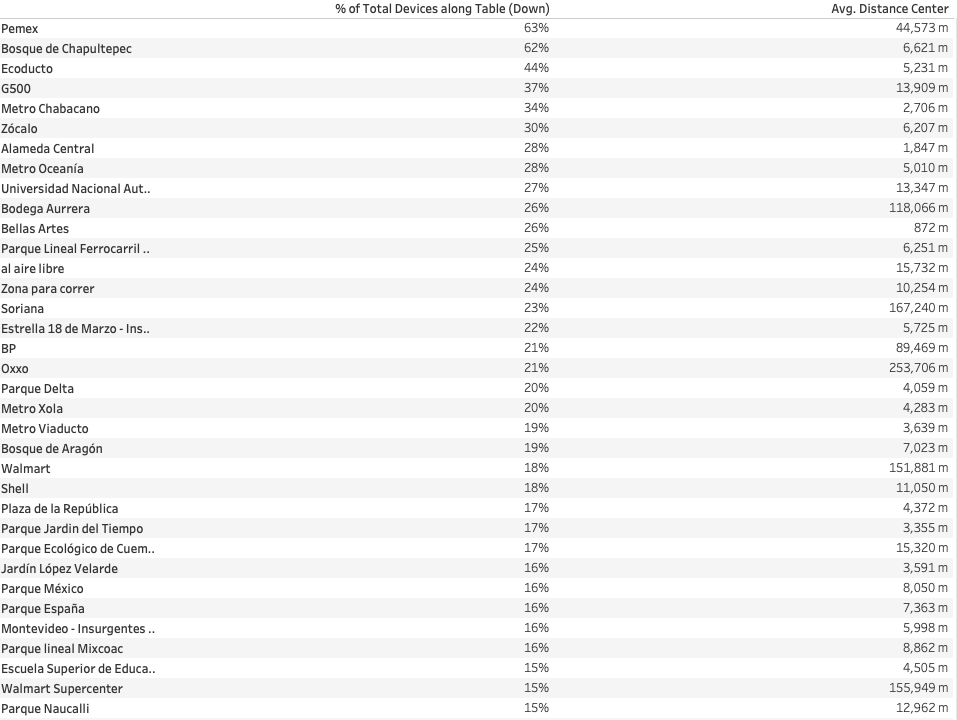
Customer Analytics
Another possible analysis is customer analytics, since it is possible to know in which other places (stores, restaurants, shopping malls, residential areas, among others) the people who visited a point of interest were, identifying the behavior of its customers, and to know where and how long they were inside and after visiting a store.
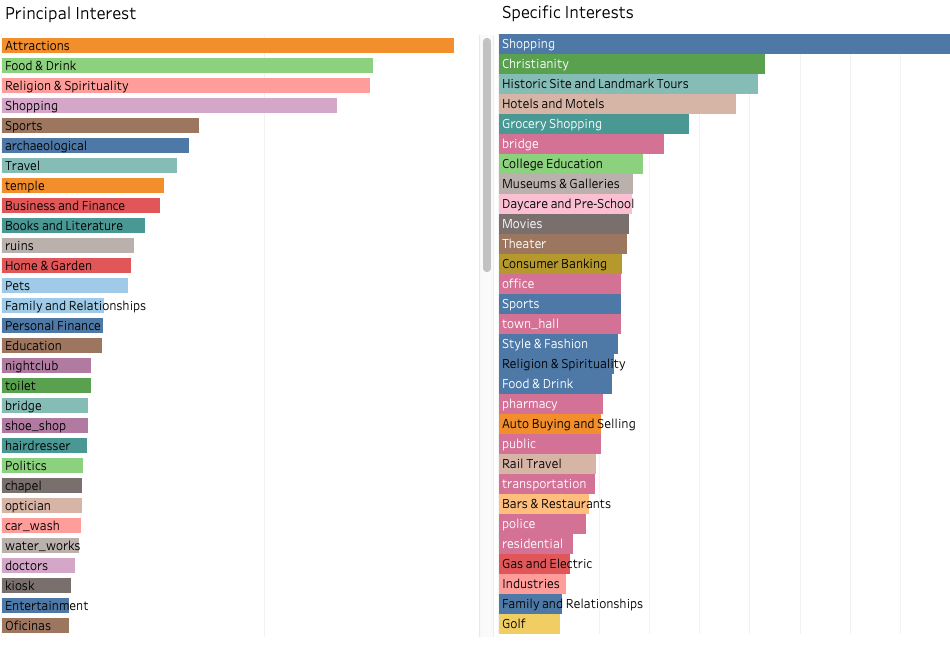
Identify suitable areas to establish expansion strategies
With data from the Wealth Index Global, collected by Facebook, it is possible to estimate income levels of the inhabitants, their age and profile. At the same time, by applying geospatial data analysis techniques, corporate buildings, residential areas, schools, etc. can be located, making it possible to clearly understand the behavior of the people who pass through a given area, their tastes, preferences and purchasing potential.
What is the revenue potential of a POI?
Through machine learning models, it is possible to predict the turnover of a given point of interest. With these models, leaders could get to know what is the potential turnover or visits of any point of sale in a specific week, month, or year. These models can also be used to predict the potential of a new outlet to be opened. This is ideal to complement feasibility studies of new points of sale in expansion plans.
Like what you see? Request a Free DEMO