Location and mobility data analytics are transforming the way marketing and sales strategies are defined in the retail business, and supermarket chains are no exception.
Understanding what consumers think, what they want and what they do is critical for companies in the retail sector. This is where Big Data tools play an important role, as it is possible to measure the affluence at a location and customer behavior, among other aspects. With this information, it is possible to model the performance of points of sale and estimate the turnover of competitors or potential locations.
With Big Data techniques, large volumes of anonymous location and mobility data are collected through mobile devices, and by combining this information with geospatial data, it is possible to analyze in detail the performance of a given point of interest (POI), such as any store, supermarket, mall or restaurant.
The correlation between foot traffic and sales in the retail and restaurant sectors has been extensively studied and tested, making the development of these studies a priority for evaluating locations.
Case Study: Walmart Revolucion vs. Soriana Hiper Estadio (Guadalajara, Mexico)
PREDIK Data-Driven carried out a detailed study of two hypermarkets operated by Walmart Mexico and Organización Soriana in Guadalajara, specifically Walmart Revolucion and Soriana Hiper Estadio.
Location data was analyzed in the two establishments and in their surrounding areas, with the objective of comparing and analyzing foot traffic in the two supermarkets. For this purpose, location data was collected and analyzed to gather insights about the behavior of people visiting both supermarkets. This analysis seeks to answer the following questions:
How are visits distributed in each establishment?
The first step is to locate both points on the map, as well as to select the area of interest. This is important because if the location is within a plaza, it must be delimited correctly to avoid considering observations that do not correspond to the specific place.
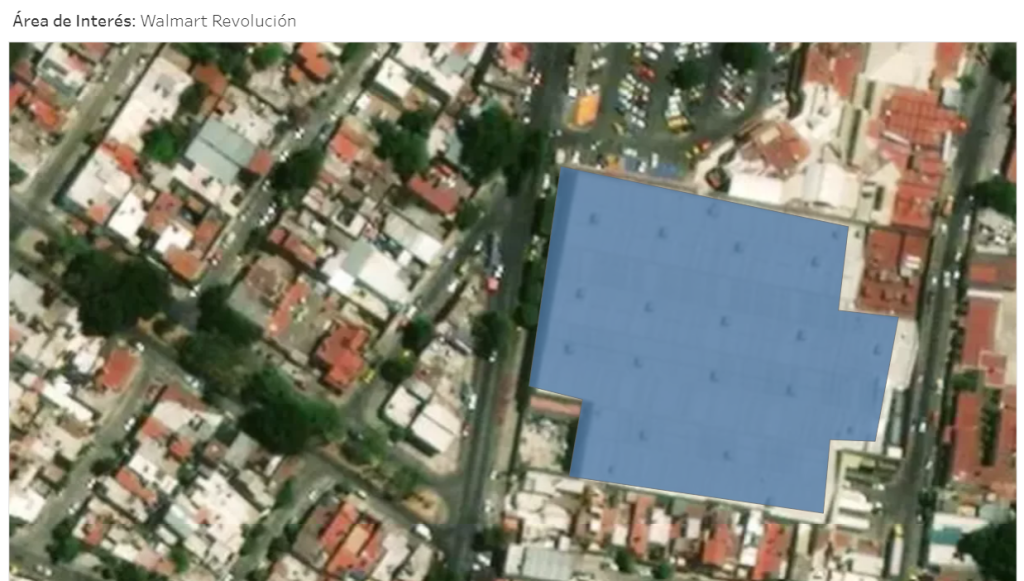
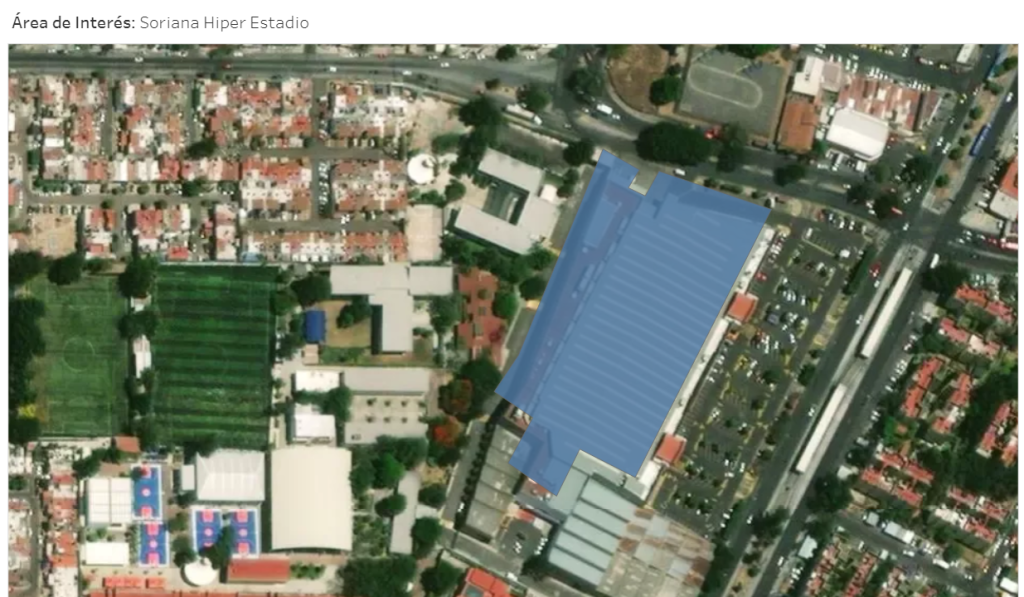
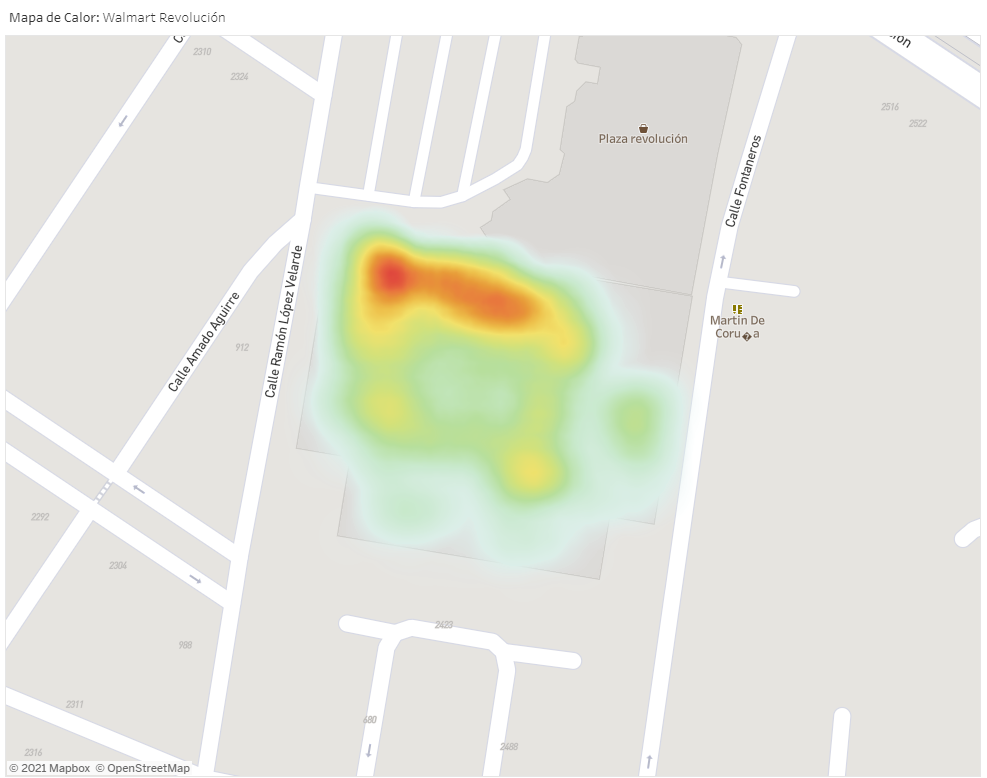
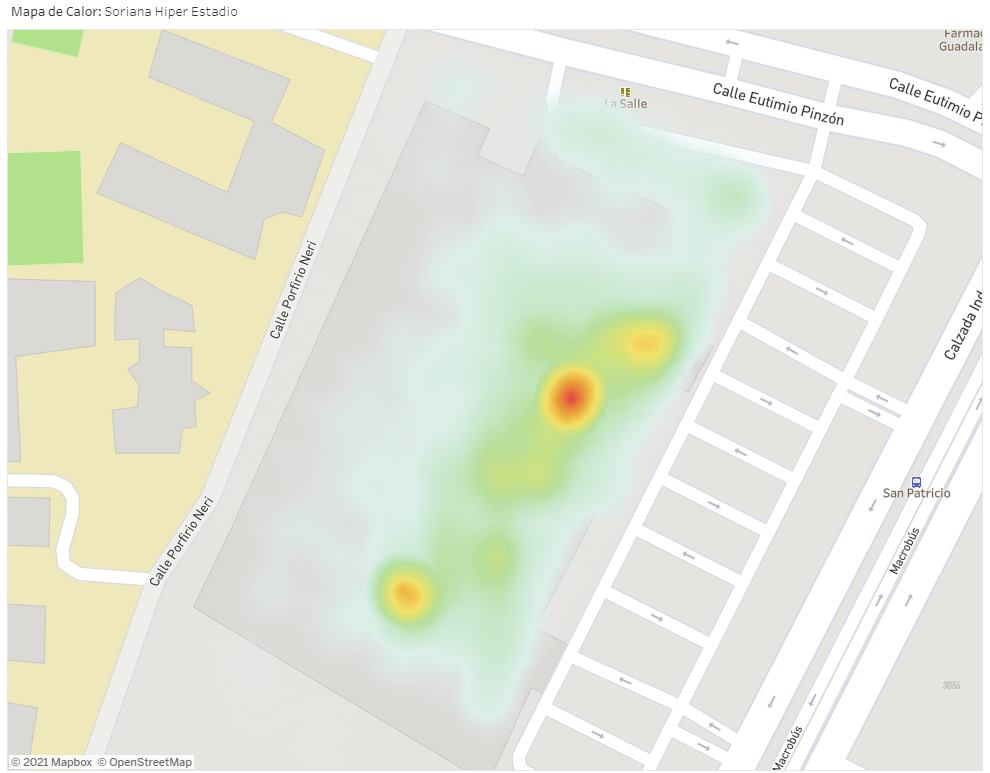
Using geospatial and Big Data techniques, all observations recorded within the areas of interest are extracted. Something to keep in mind is that the resolution of the data is such that it allows us to see in which specific areas inside the supermarket, the movement of people is concentrated. This is very useful when conceptualizing the design of the interior space and the distribution of the sections that make up the supermarket.
Heat map showing the concentration of people inside the Walmart Revolucion supermarket:
Heat map showing the concentration of people inside the Soriana Hiper Estadio:
With this information, a natural question arises: Which supermarket is most visited?
Percentage distribution of the visits registered in the period analyzed:

With the correct analysis of registered visits, we know that Walmart has 55% more visits than Soriana supermarket, which corresponds to the popularity and size of each store.
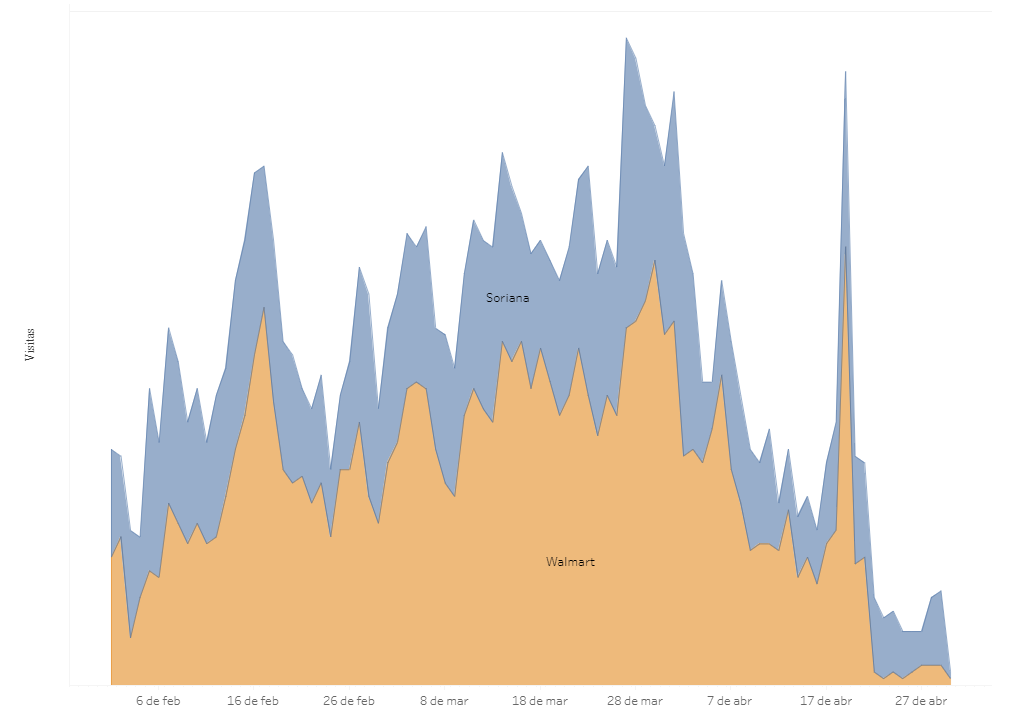
It is also possible to see the evolution of visits over time, which can be very useful to identify trends in the behavior of visitors and potential customers.
Analysis of the evolution of foot traffic (visits) between February and April 2021:
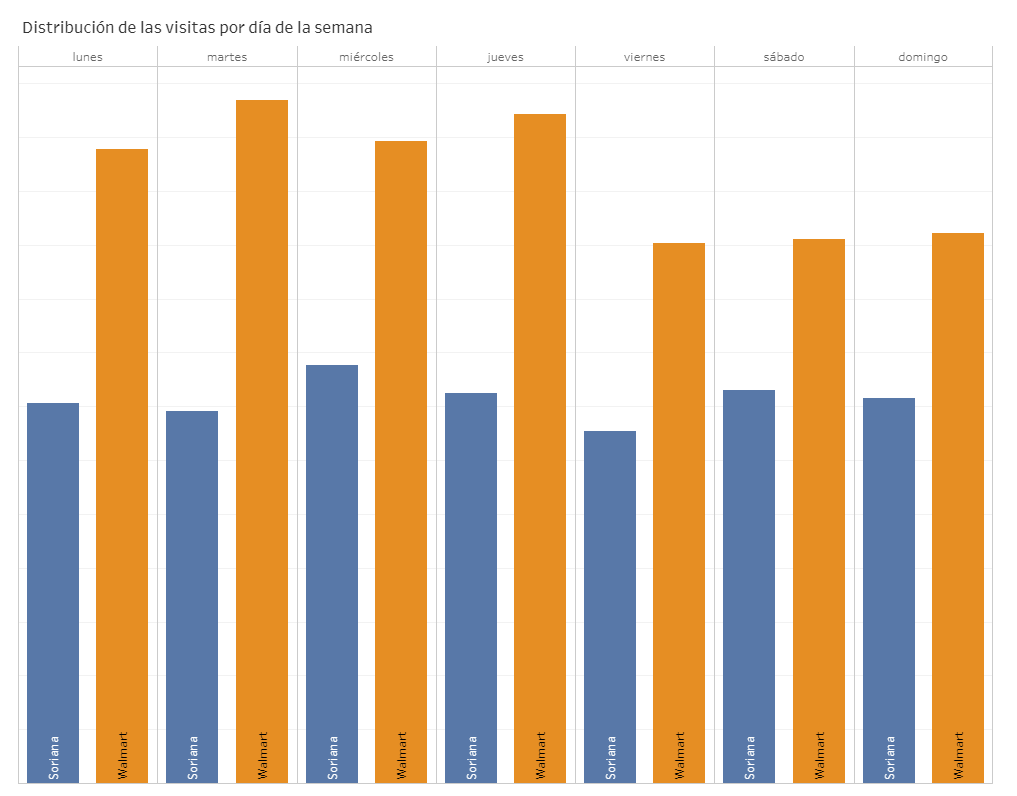
What days of the week register the highest foot traffic?
Location data is multidimensional, which means that in addition to knowing the exact point of a visit, we know the exact time at which it was recorded. This allows us to better understand consumer behavior and design practically personalized commercial strategies.
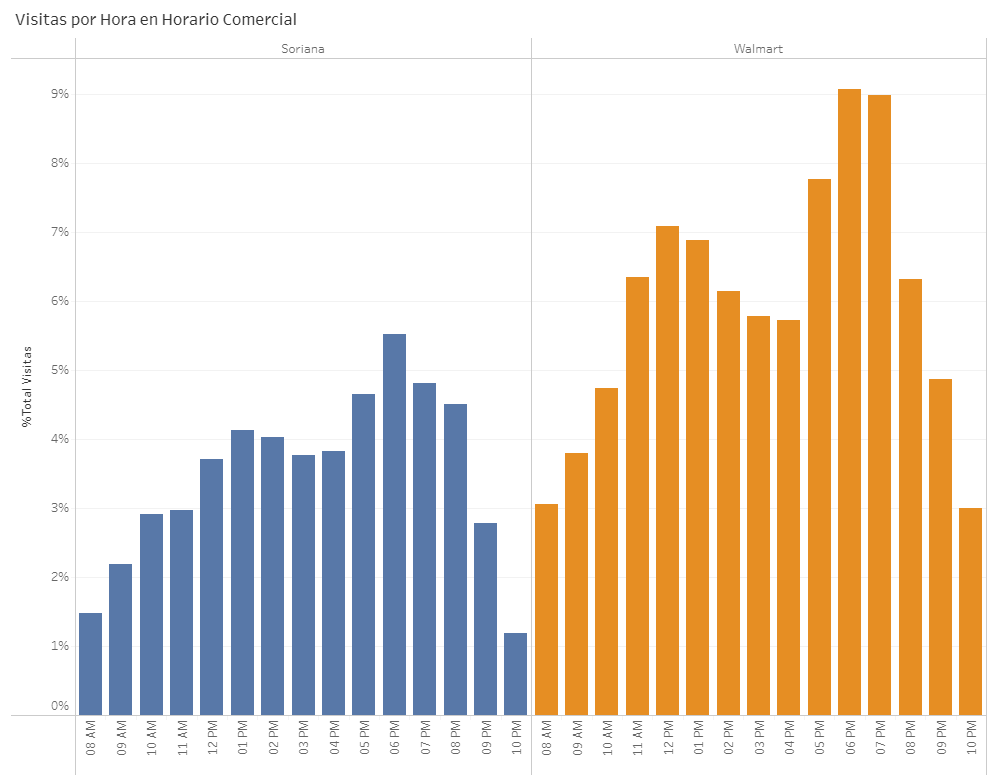
It is also possible to further analyze the data and determine the visits per hour. This analysis serves both to know the busiest times, as well as to identify the devices of the workers of both establishments, since they are the ones that will be out of business hours.
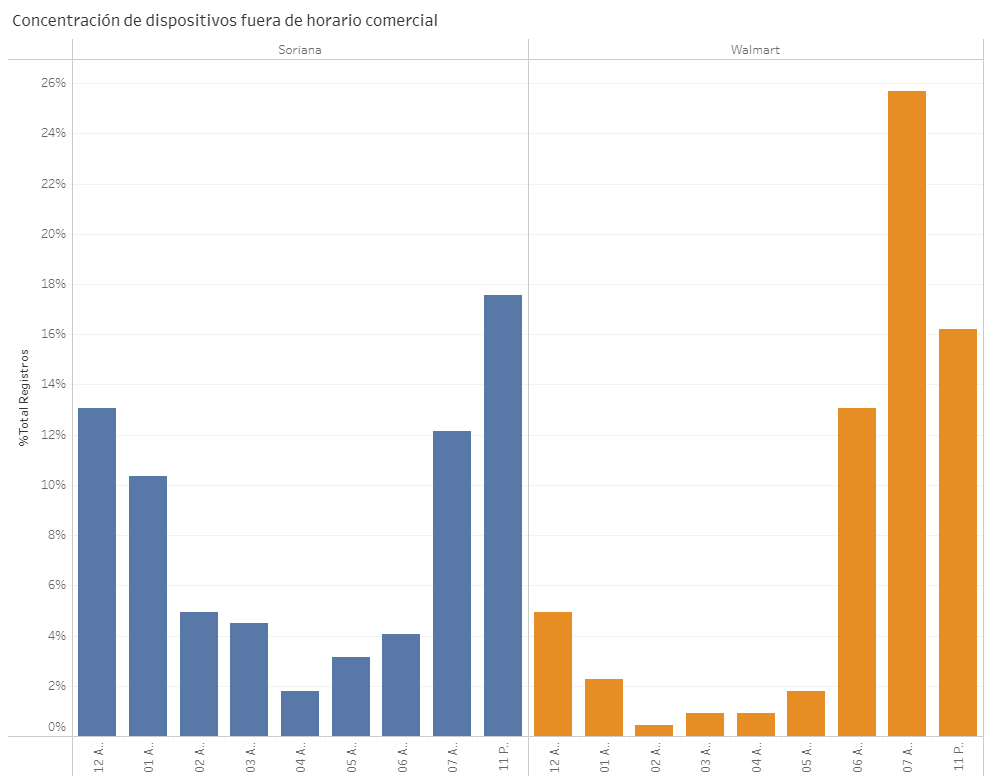
In the same way, we identified the hours in which there is a higher concentration of workers outside business hours. This data is very interesting, as it can help to understand the supply, distribution and inventory process of the competing supermarket.
What are the characteristics of the surrounding areas of Walmart Revolucion and Soriana Hiper Estadio?
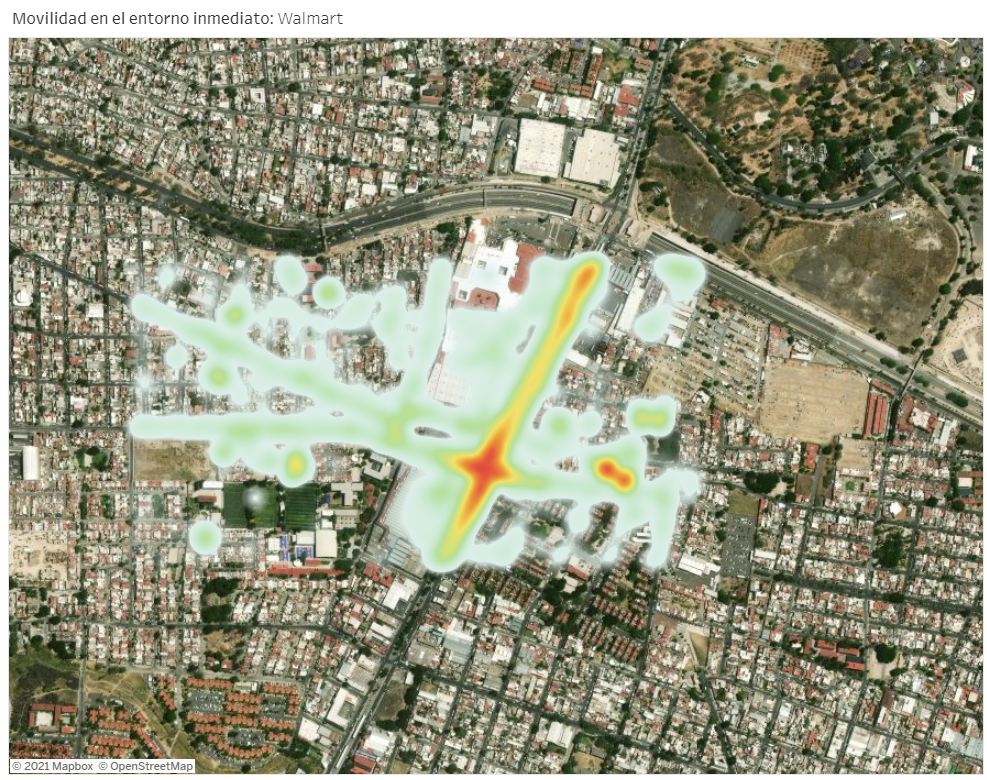
Although visits are correlated with the performance of an establishment, they are not the only important factor. Another fundamental aspect that should be analyzed is the environment of the location, since it allows to know other commercial establishments, to analyze the visitation they receive, and to understand how they are and how potential customers who move around the supermarket behave.
[button button_text=”Like what you see? Request a free DEMO” button_style=”style-1″ button_arrow=”true” button_rounded=”true” font=”Default” button_size=”medium” font_size=”” button_icon=”” button_align=”center” padding_v=”” padding_h=”” button_link=”/request_demo/” link_open=”_self” href_title=”” id=”” class=”” bg_color=”” text_color=”” border_size=”” border_color=”” border_radius=”” h_bg_color=”” h_text_color=”” h_border_size=”” h_border_color=”” h_border_radius=”” margin_top=”” margin_bottom=”” margin_left=”” margin_right=””]
Heat map showing the mobility of people around Walmart Revolucion:
Heat map showing the mobility of people around Soriana Hiper Estadio:
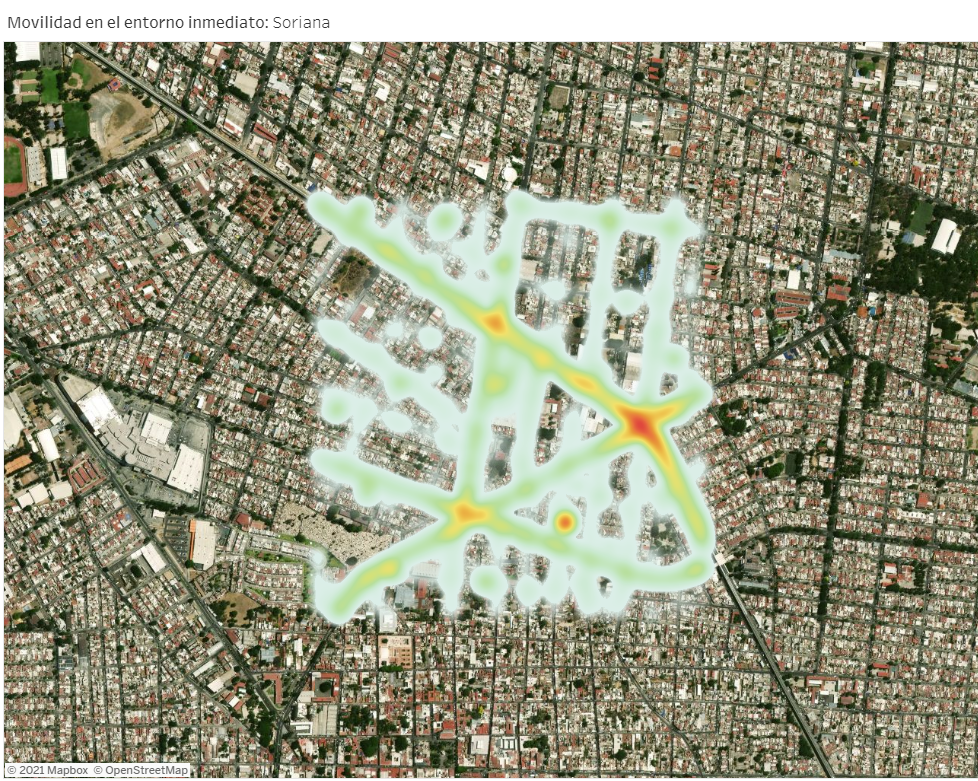
The analysis of the surrounding areas gives us a more general picture of the area and how many people move around. This data, combined with other factors, is really useful when it comes to predicting the turnover of an establishment.
What other insights can be obtained by analyzing location data?
Understanding which customers share both chains
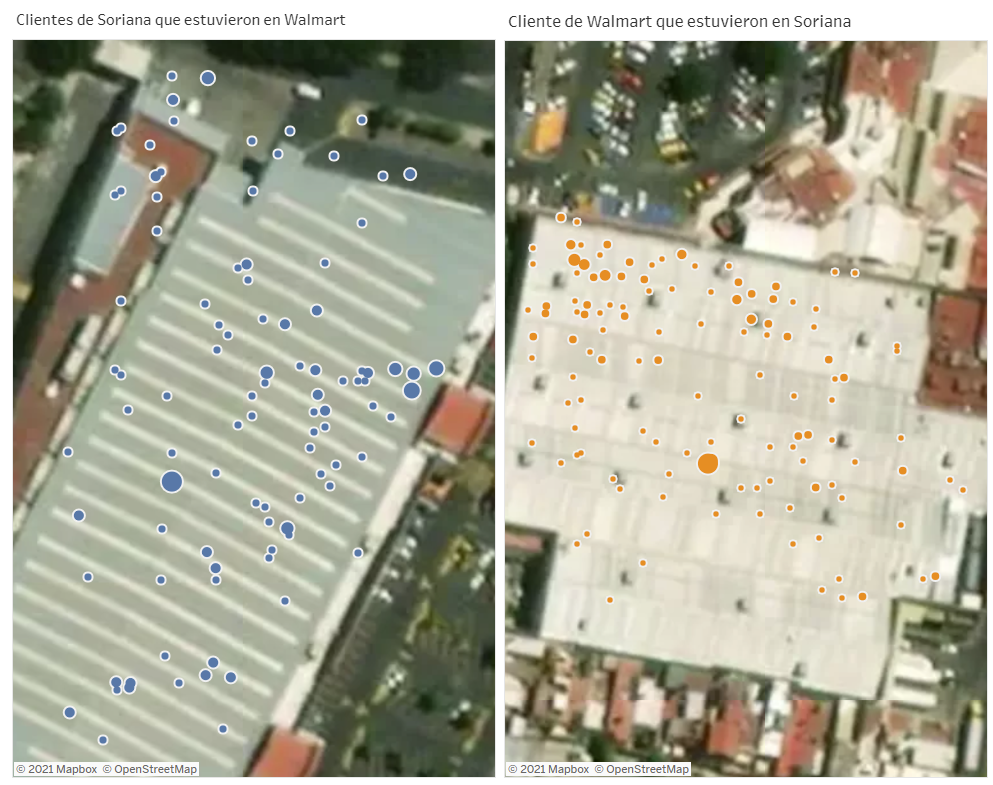
By analyzing the records of mobile devices registered during a given period of time in a specific location, such as a supermarket, it is possible to identify consumers, and know, for example, that customers who identified themselves at the Walmart supermarket are also customers of the Soriana supermarket.
Analysis to identify Soriana customers who were also at Walmart, and vice versa:
These solutions benefit any type of business and sector, an example of this is another case study that was conducted to compare two of the most popular fast food franchises in the city of Monterrey, Nuevo León Mexico, the findings were interesting. Read more about this case: “McDonald’s Vs. Burger King: Foot traffic Analysis“.
Customer Profiling
Another possible use is customer profiling, since it is possible to know in which other places (stores, restaurants, shopping malls, residential areas, among others) the people who visited an establishment were. Thus, Walmart and Soriana can know how their customers behave, since they can know where and how long they were before and after visiting their supermarket. This allows them to generate high-value insights to optimize the understanding of current consumers and search for new potential customers with similar behaviors.
Identifying suitable areas to establish new points of sale
With mobility data, it is possible to clearly understand the behavior of the people who pass through a given area, understand what they are like, their tastes, preferences, socioeconomic level and purchasing potential. This, together with an in-depth analysis of the commercial establishments in the area in question, becomes a crucial factor in determining the best locations for the opening of new stores.
What is the turnover potential of my competitors´ stores?
Through machine learning models, it is possible to predict the turnover of a specific POS. With these models, Soriana could get to know what is the turnover potential of its competitor Walmart in a specific week, month, or year. These models can also be used to predict the turnover potential of an outlet that is about to open. This is ideal to complement feasibility studies for new stores in expansion plans.
Contact us for more information about our Location Analytics Solutions for Retail Companies

