Coffee shop owners need to apply location intelligence and mobility analytics techniques to identify consumer behavior patterns, in order to maximize sales and generate more efficient expansion models.
Case Study
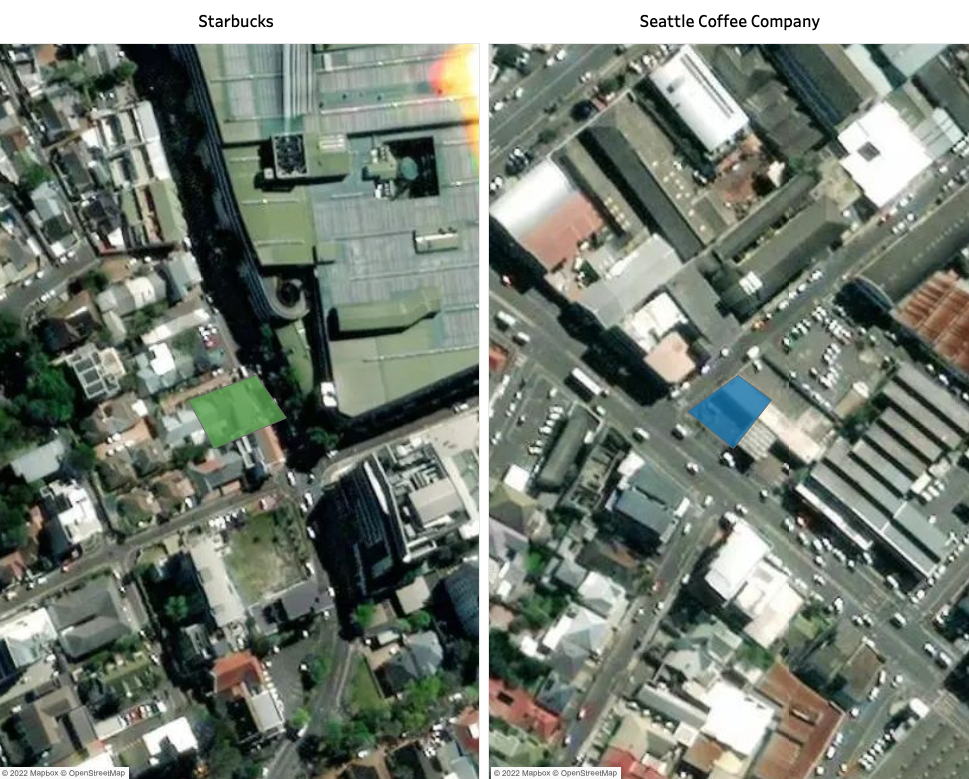
Foot traffic comparison: Starbucks Cavendish Square y Seattle Coffee Company Salt River, Cape Town, South Africa
At PREDIK Data-Driven conducted a mobility study around two coffee shop retail franchises in the city of Cape Town, South Africa: Starbucks Coffee and Seattle Coffee Company.
In this case study, we analyzed the mobility patterns and foot traffic around both establishments by conducting a 400 m2 polygon, in order to profile and understand the behavioral patterns of consumers who visit or have registered movement outside both establishments. This analysis aims to answer the following questions:
How are the visits displayed?
In this type of analysis, we generate polygons to measure all the records contained inside the areas.
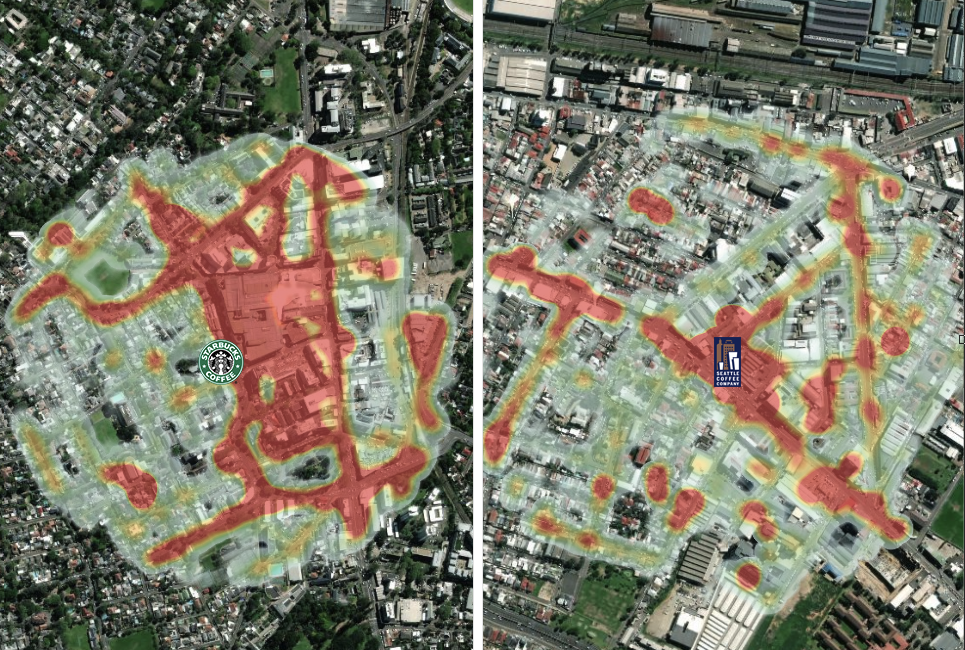
In which of the areas do we identify the most foot traffic between the month of December 2020 and January 2021?
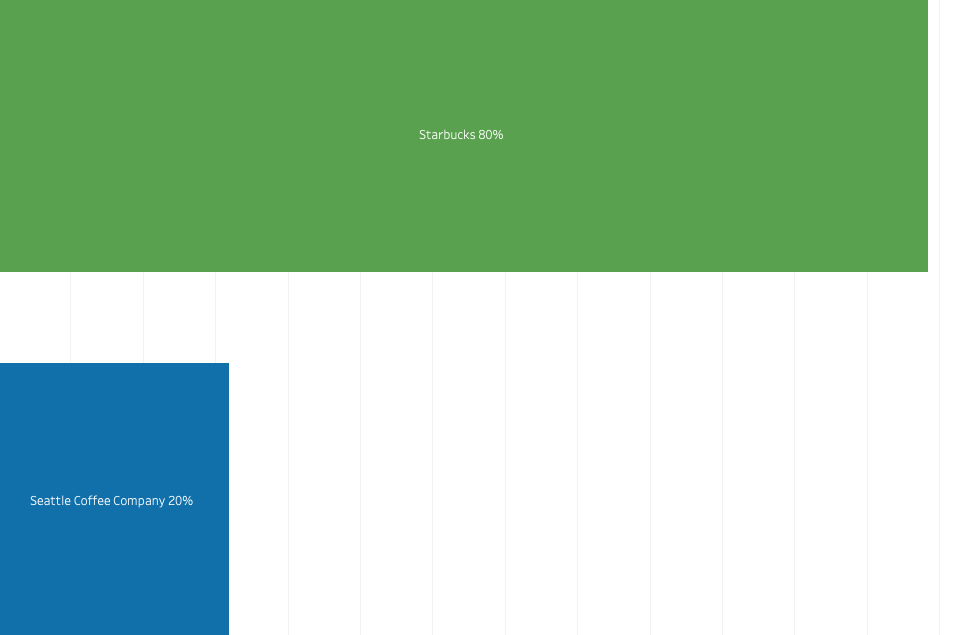
By analyzing the mobility of both coffee shops using the established time period, we identified that there is a 60% higher foot traffic in the Starbucks area compared to where the Seattle Coffee Company is located, this has a direct correlation with the location of the stores and the avenues or streets around them.
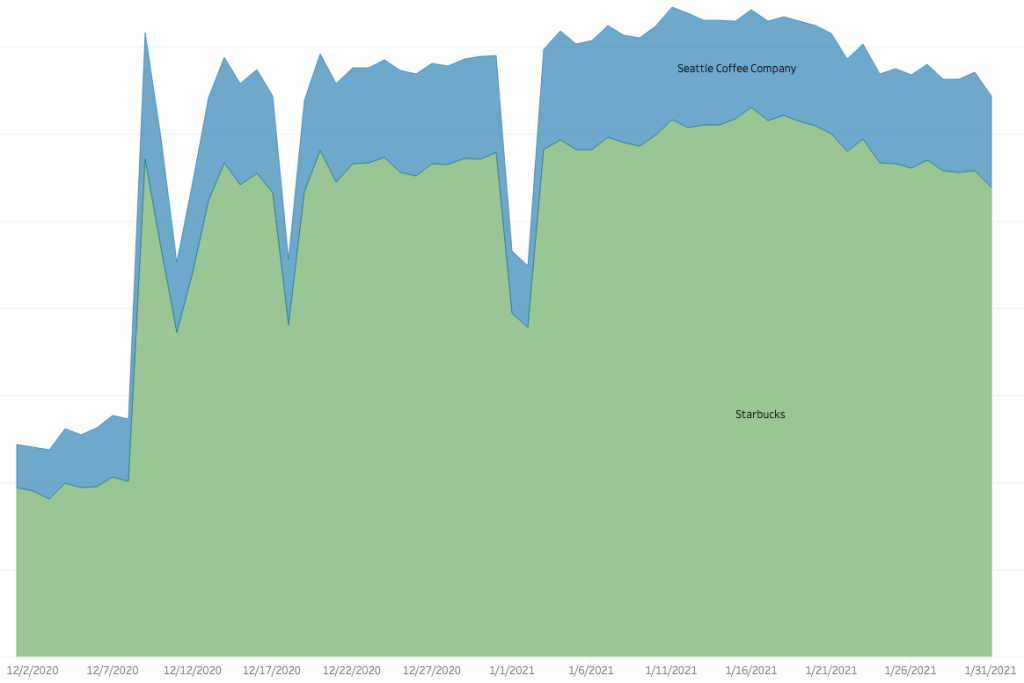
These analyses allow businesses to observe the evolution of visits over time, which can be very useful to identify patterns of foot traffic customer behavior and market trends in high and low traffic seasons.
Identify consumer behavior: Which days of the week are the most visited?
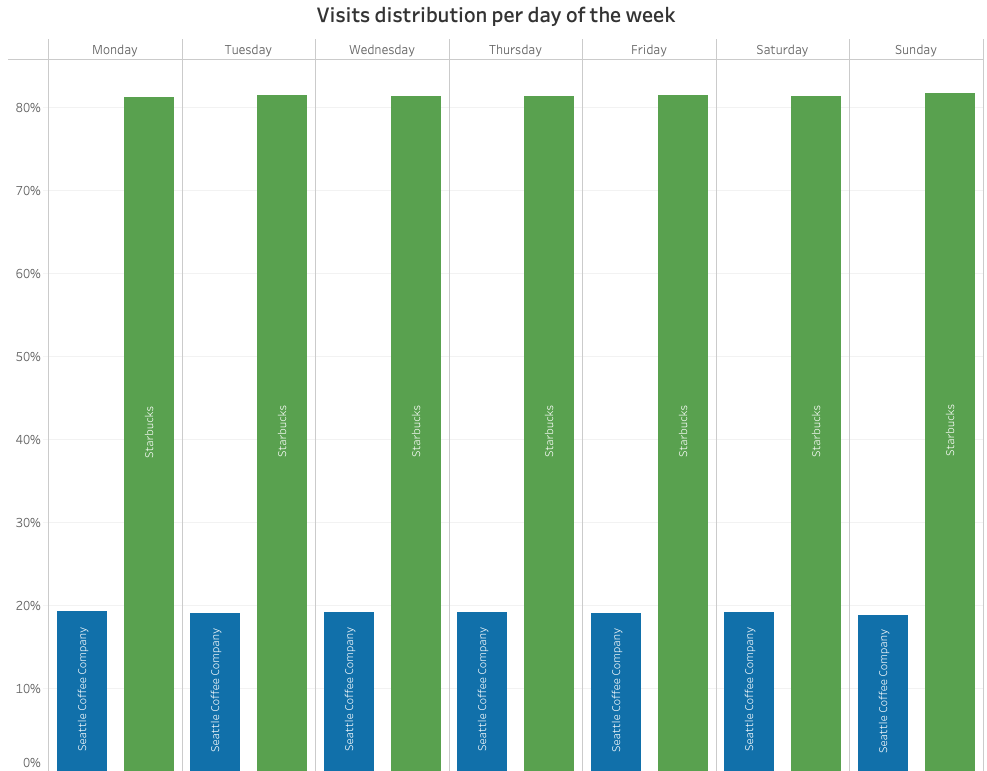
One of the most interesting applications of location intelligence is that it allows gaining detailed knowledge of customers’ behavior patterns by day, hour, month, or year, offering valuable insights to design marketing campaigns and commercial strategies based on the power hours of the coffee shops.
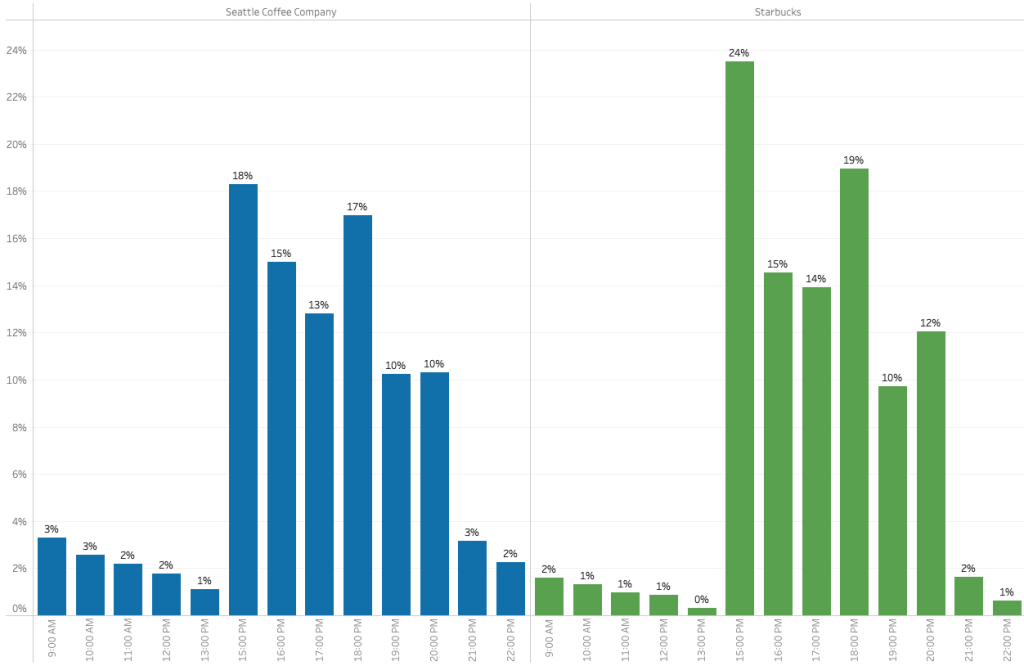
This analysis is very useful to know what is the performance of the shopping malls at peak and off-peak hours of the day.
What is the foot traffic mobility pattern around both coffee shops?
Although foot traffic is related to the performance of any retail location, it is not the only key factor for success. Another fundamental aspect to be analyzed is the environment of the outlets, as it allows for comparisons and estimates of the number of visits, revenues, strategic and operational movements of the competition.
By gathering information on potential customers, it’s possible to carry out a more detailed benchmarking and generate strategies to capture the competitor’s clients.
This analysis of the environment provides us with a detailed picture of the surrounding areas and the mobility patterns of people moving through the area. This data, combined with other factors, provides deep insight into predicting the revenues of any retail establishment.
At PREDIK Data-Driven we conducted a comparative study of two shopping malls in the city of Cape Town, South Africa: Vangate Mall, which contains distinguished brands such as Tekkie Town, Cell C, Studio 88, Rocomamas, Nando’s, Jimmy’s Killer Prawns, among others, and Maynard Mall, another shopping mall made up of renowned brands like Shoprite, Clicks Pharmacy, Rage, Jumbo, FixIt, Total Sports. Read the full article here
What other insights can be gained by analyzing footfall at Coffe Shops?
By analyzing data over a given period of time at a specific location, it is possible to estimate the percentage distribution of consumers who visited both coffee shops.
Customer Analytics
With this analysis, it’s possible to infer in which other places (stores, restaurants, shopping malls, residential areas, among others) the people who were at a point of interest also visited. Thus, Starbucks and Seattle Coffee Company can analyze how their customers behave, since they can look where and how long they were before and after visiting the stores. This allows them to generate high-value insights to optimize the understanding of current consumers and search for new potential customers with similar behaviors.
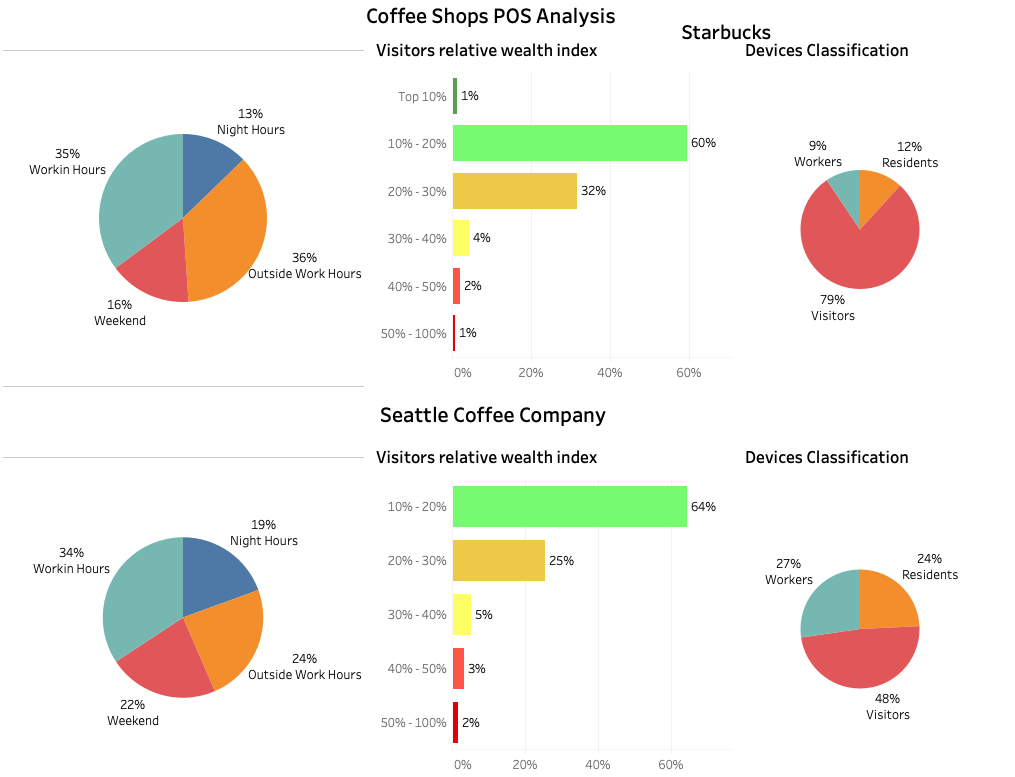
Identifying ideal areas in expansion and site selection strategies
With mobility data, it’s possible to clearly understand the behavior of the people who pass through a given area, how they’re alike, their tastes, preferences, relative wealth index, and purchasing potential. Including an in-depth analysis of the commercial establishments in the area in question, becomes a crucial factor in determining the best locations for the opening of new stores.
