GIS, “Geographic Information System,” allows you to interpret and analyze location data more efficiently and faster.
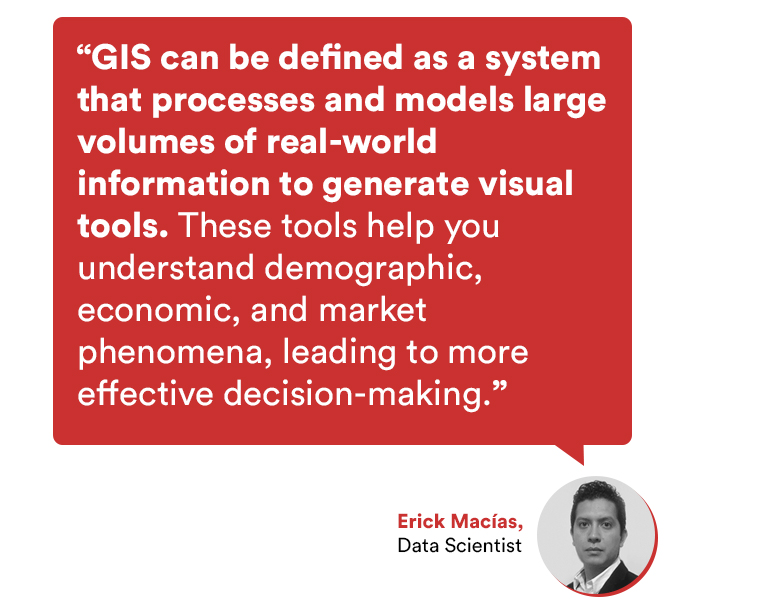
Erick Macías, our data scientist, defines GIS as a system that processes and models large volumes of real-world information to generate visual tools. These tools help you understand demographic, economic, and market phenomena, leading to more effective decision-making.
GIS works mainly to visualize “geospatial data” in a map. This tool is helpful because “raw data” can be unfriendly to read, especially for not technical people. As Jack Dangermond mentions, GIS is about uncovering meaning and insights from within data. It is rapidly evolving and providing a whole new framework and process for understanding.
In this article we will cover the following topics:
How does GIS work?
GIS technology contemplates three elements: Geospatial data, analysis, and mapping tools.
Geospatial data includes addresses, coordinates, photographs, and map information. Geospatial data can connect to historical and descriptive information such as spreadsheets or tables.
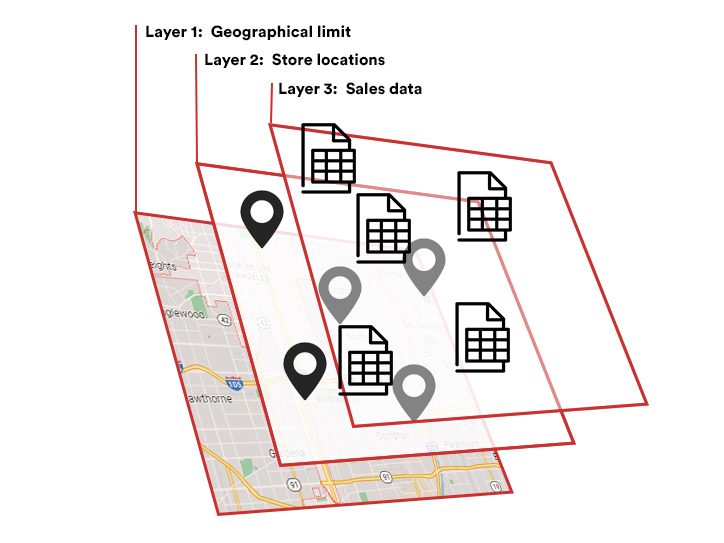
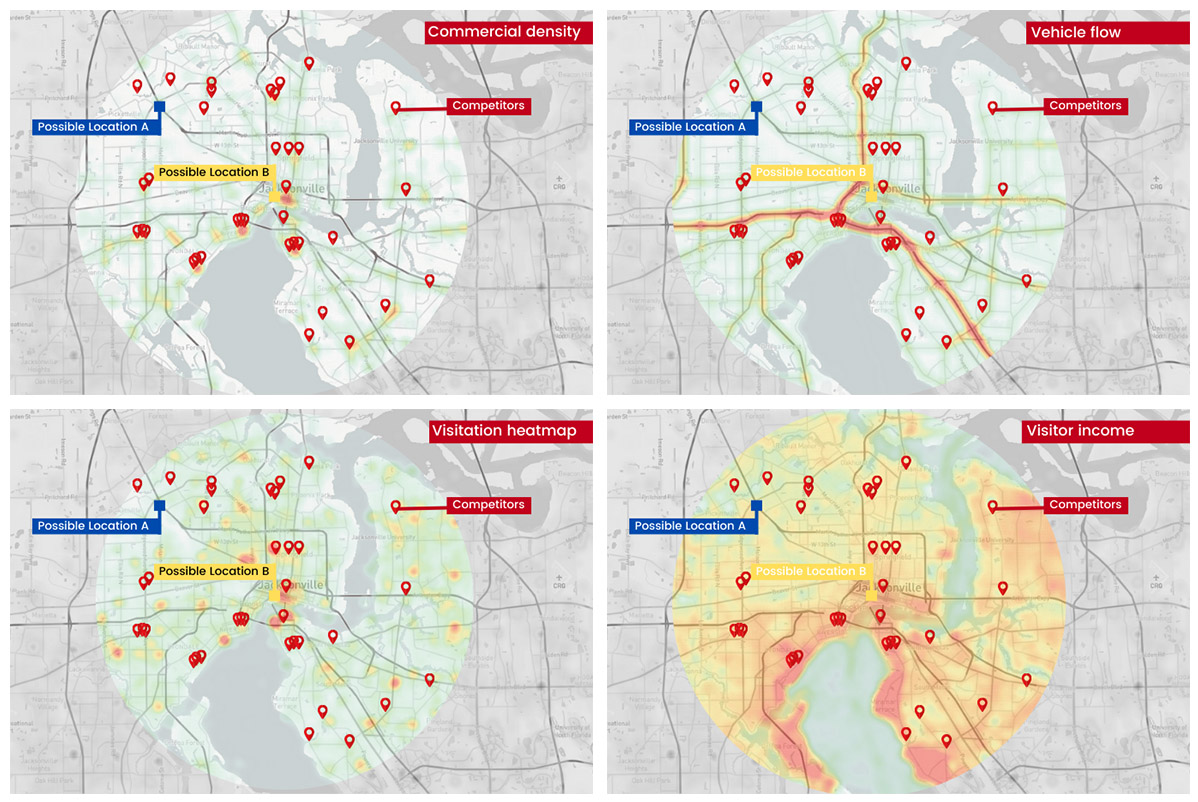
GIS maps can integrate different layers of data, one above the other. For example, a map can have three layers: The first one contains the geographical limits, the second includes the stores locations in that area, and the third one contains data about the stores´ internal sales data.
Data Analysis
Data doesn’t mean anything without a proper interpretation. Data analysts use all the collected information to give context and identify insights, patterns, and relations according to a specific problem.
For example, a retailer expanding to a new city can use GIS technology to identify the best locations for new stores.
Mapping tools
Maps are the visual element that contains the analyzed data; that’s why they need to be easy to interact with and read.
There are different types of maps according to the data that needs to be analyzed:
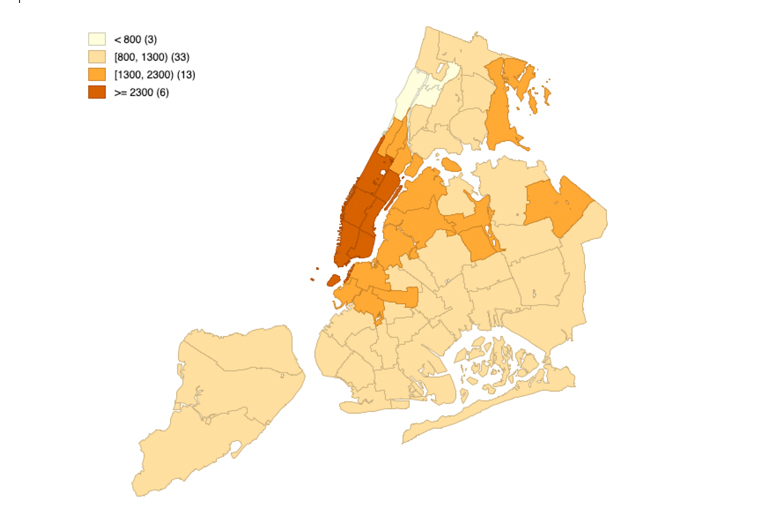
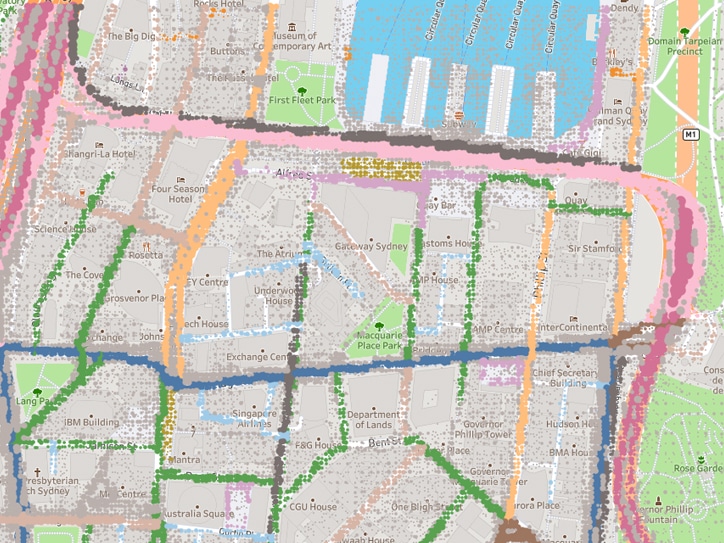
Category maps allow you to relate locations with specific categories such as sales territories.
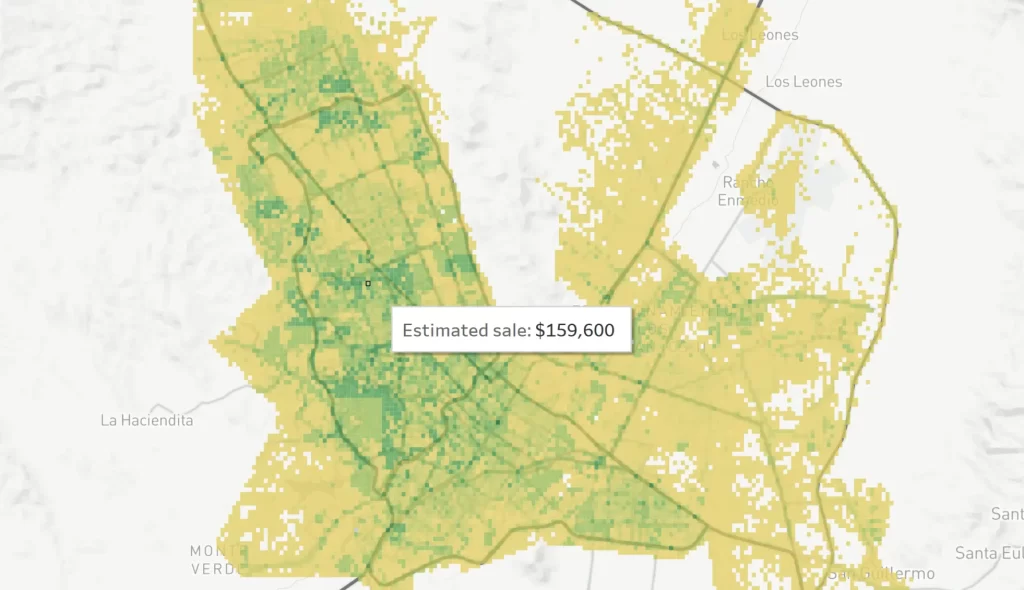
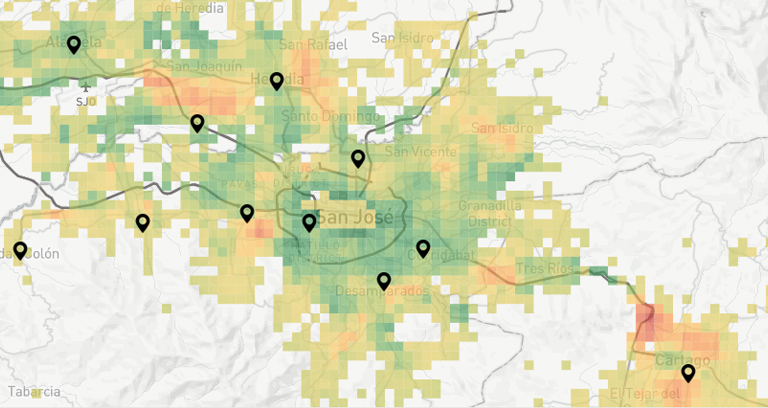
Quantity maps show color gradients. In the example, the greener areas represent the highest-income neighbors in that city.
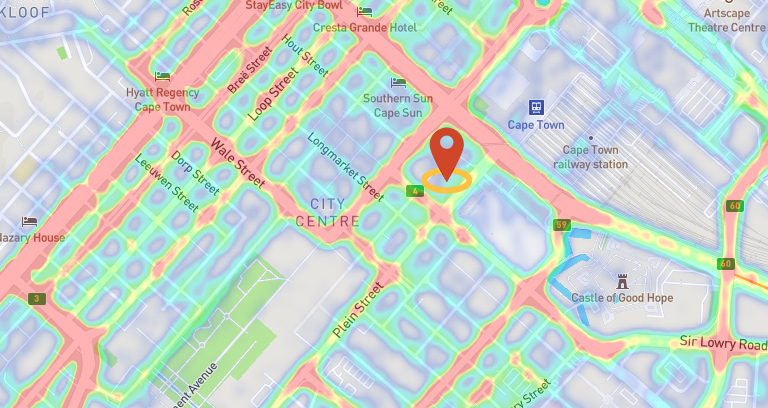
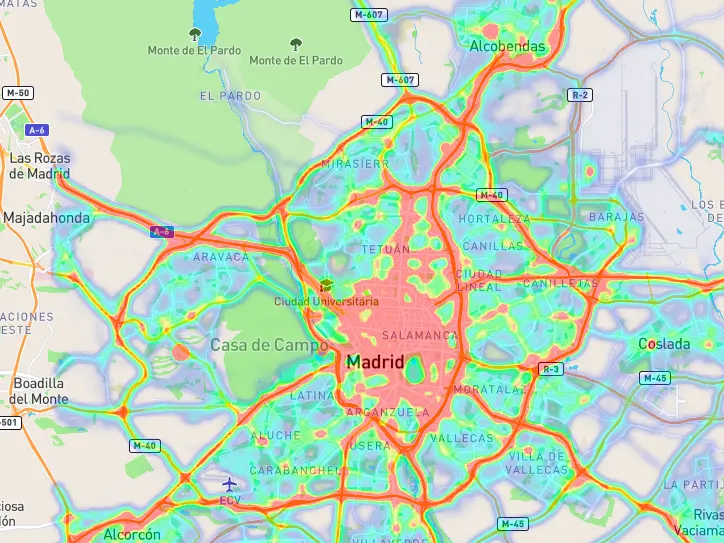
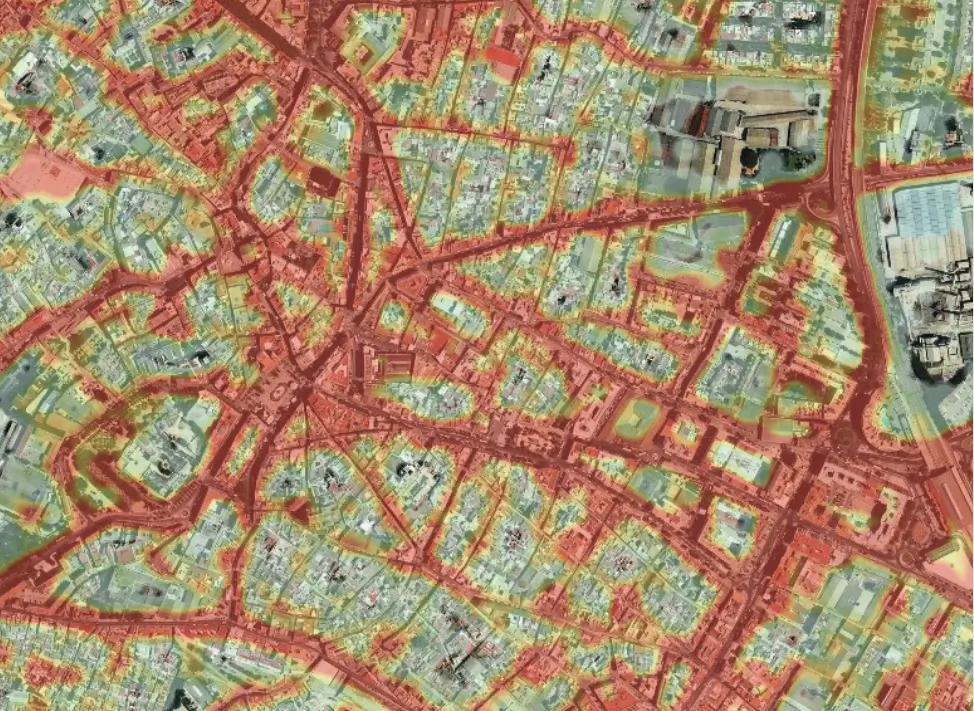
Heat Maps analyze density in specific locations, like areas with a high volume of people or vehicular traffic.
Why GIS is so helpful for businesses and companies?
GIS, or Geographic Information System, enables businesses and companies to create digital maps with layers of information to solve real-world problems.
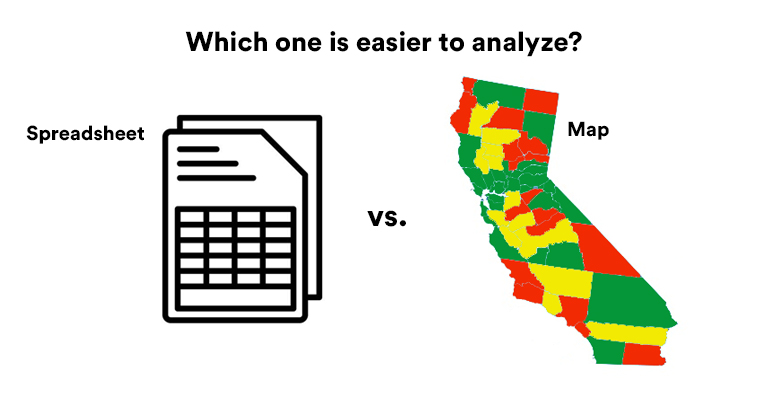
GIS Mapping can give you answers to complex questions and help you to make better business decisions. It’s not the same to read a big spreadsheet trying to figure out big pieces of data as looking at the same information in an interactive map with colors, symbols, and figures.
As Jamie Martindale mentions, “GIS can be used as tool in both problem solving and decision making processes, as well as for visualization of data in a spatial environment.“
As time has passed, GIS has evolved into a tool for data sharing and collaboration. These days, organizations can use GIS mapping to tell stories and reveal patterns, trends, and relationships about a wide range of topics.
Understand user behavior
GIS Mapping can show you how users move, where they go, and what places they visit. This information can benefit industries like retail, logistics, services, or investment when making decisions based on increasing ROI and reducing costs.
For example, a packaging and delivery company like DHL can use GIS technology to analyze roads with the highest traffic concentrations and car accidents to optimize their route planning.
Monitor facilities changes
Using GIS mapping techniques based on aerial imagery, you can identify relevant changes regarding the infraestructure of target facilities from competitors, suppliers or business partners.
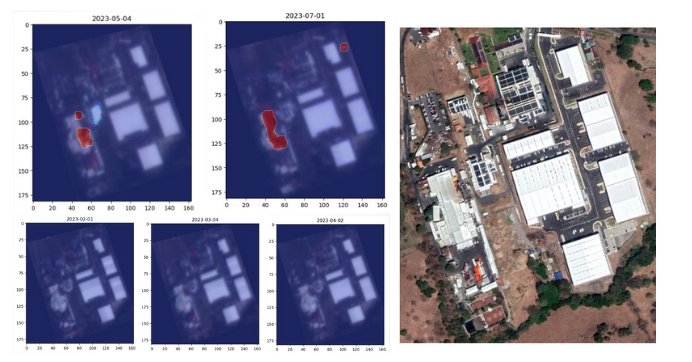
For example, the image shows a fire incident in a chicken incubator facility and the magnitude of the problem.
Identify internal problems
Sales and marketing managers can use GIS Mapping to analyze the behavior of their different sales locations. For example, Pizza Hut’s regional manager can identify which restaurants have supply problems or are underperforming in sales.
Spot trends and unique opportunities
Real estate developers use GIS Mapping to understand a particular area’s demand, growth, and movement to identify the best place to buy and build a project. Developers can perform specific forecasts and see them through the map.
Should you use GIS Mapping?
Remember, GIS Mapping is a way to understand big and complex pieces of information quickly. This tool will be useful if you need to make decisions based on geographical locations and consumers´ behaviors.
You also need to consider the quality of your data, analysis, and tools. As part of data science, GIS technology can be very powerful, but it needs to the treated correctly.
Right now, organizations from all industries (Like insurance, manufacturing, real estate, retail, transportation, and insurance) use this technology in their decision-making processes.
In PREDIK Data-Driven, we have more than 14 years of helping companies to solve complex problems with data science. Our analyst will bring you the information you need to make critical decisions.