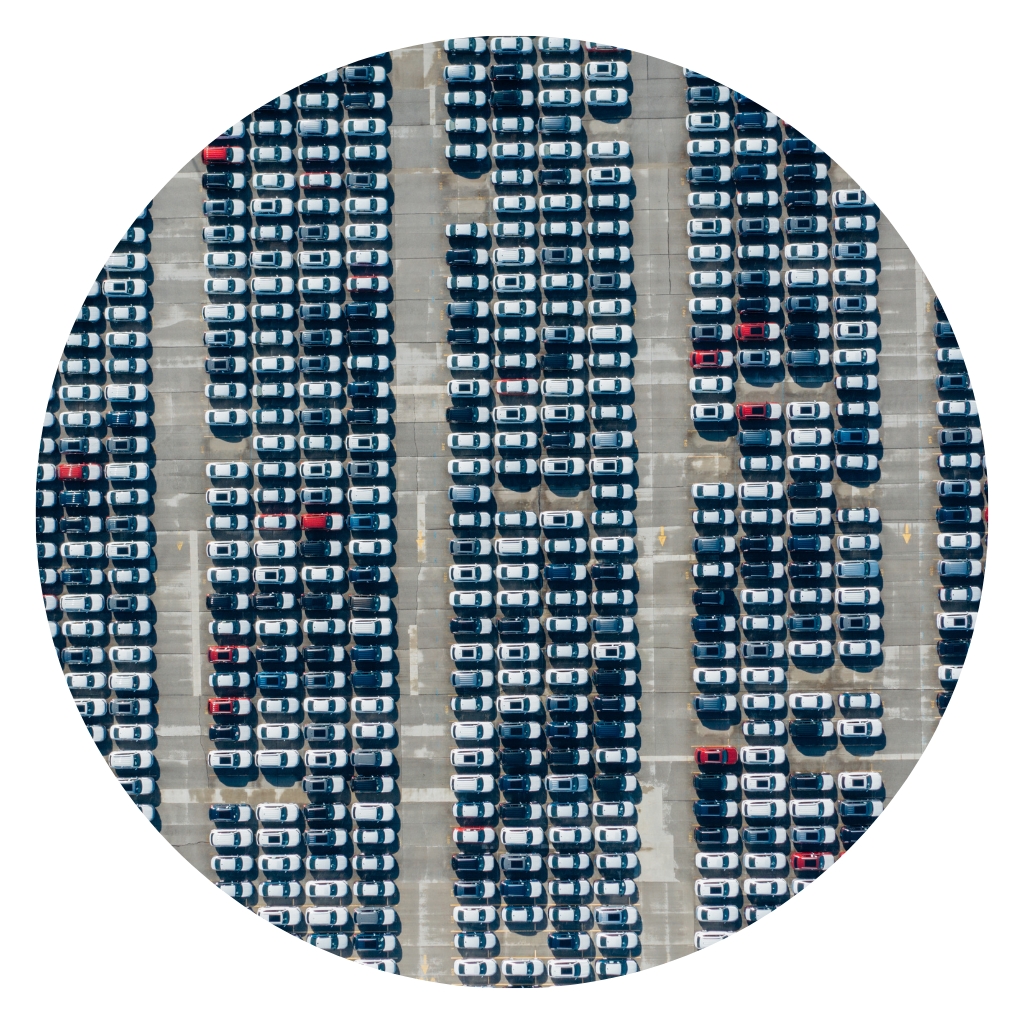
Accurately track car occupancy and parking availability changes
Parking Availability & Occupancy Variance Index based on satellite data
Coverage
History
Fromats
Make Smarter Decisions
Why you should use this dataset?

Daily monitoring
Track variance occupancy on a daily, weekly, monthly or yearly basis.

Near-real time data
Identify and track relevant trends based on robust and reliable data.

Cost-effective
Our new satellite imaging tech monitors parking availability and vehicle occupancy at a lower cost.

Leverage your satellite imagery data, mapping data, and POI data to help you make strategic decisions at a lower cost.
We evaluate people’s mobility patterns by analyzing anonymized Big Data from mobile devices and combining it with location-specific social demographic characteristics.
Featured attributes of the data
Increase visibility into available parking spaces worldwide and compare them using advanced Point of Interest (POI) and Map Data.*
*This excludes restricted areas (Like army facilities and gubernamental locations).
Track occupancy variance up to two years. Analyze changes in occupancy and area structures over time; our solution adapts to your evolving business needs.
Main use cases
- Identify trends and insights to optimize pricing strategies.
- Track and predict occupancy in competitor’s lots.
- Uncover hidden patterns and trends in specific parking spaces.
- Measure, analyze, and predict parking occupancy and availability in specific moments (i.e., large public events, etc).
Main use cases
Main challenge:
Understand car occupancy in their competitors’ parking lots to optimize their commercial strategy.
Analysis scope:
Open parking lots in the surroundings of DFW International Airport (Dallas, TX, USA).
Results:
Detection of user patterns within competitors’ parking spaces and better optimization of their pricing strategy.

The Parking Spot South located near the DFW airport
Click to see the sample we made for a parking lot located near the located near the DFW airport>>
Methodology
- History: 2 years of historical data.
- Frecuency: Daily, Monthly, Quarterly, Yearly.
- Data Delivery Methods: S3 Bucket, SFTP, Feed API.
- Delivery Formats: XLX, XLS.
- Geographic Coverage: Worldwide (Explore any country around the world).
Looking for other kind of dataset?
No matter your data needs, there is something in our vast data base that can suit your needs. Plus, we can adapt to you specific requirements.
Why PREDIK Data-Driven?
We have more than 14 years of experience developing modern data mining techniques and generating data-driven solutions for corporations worldwide.
Leading organizations trust PREDIK’s data intelligence


Get high-value & actionable data insights
Schedule a 20-minute meeting with our experts to discuss your data requirements and develop a customized dataset.
Our data-driven methodology has helped some of the most important corporations in the US, Europe, Latin America, and Asia Pacific.