The clothing store market is one of the most popular in the USA, with Big data analytics and location intelligence techniques we made an brief exploratory analysis in Atlanta city.
Case Study: Analysis of Apparel Stores in Atlanta, USA
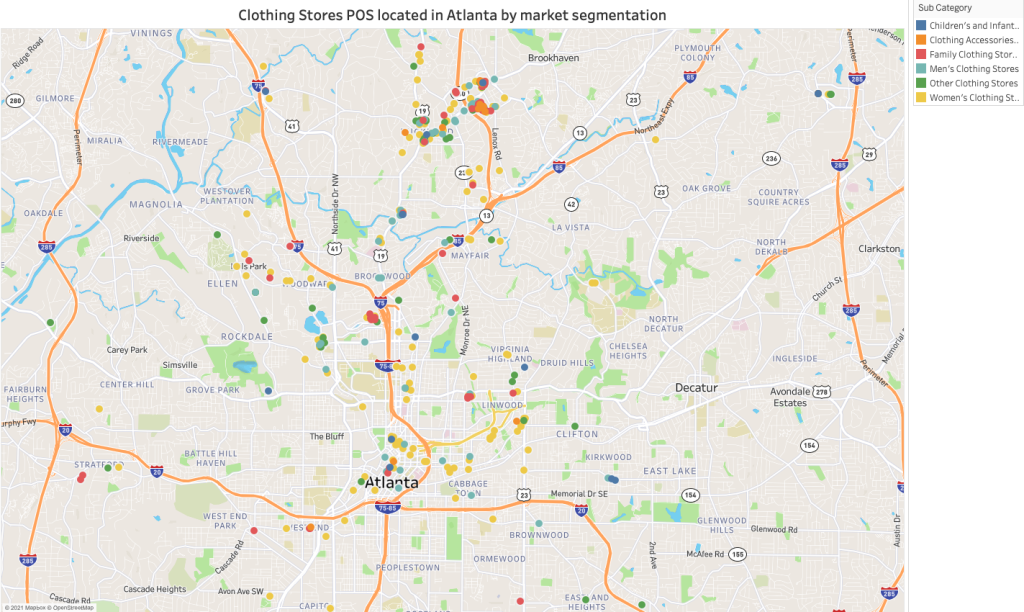
Using location intelligence techniques it was possible to identify all the stores distributed in the city, the detailed analysis allowed us to classify the venues by market share and identify in which areas of the city they are located. Our research showed that the women’s clothing category is the one with the largest number of stores in the center of Atlanta, while the other categories are distributed in the surrounding areas.

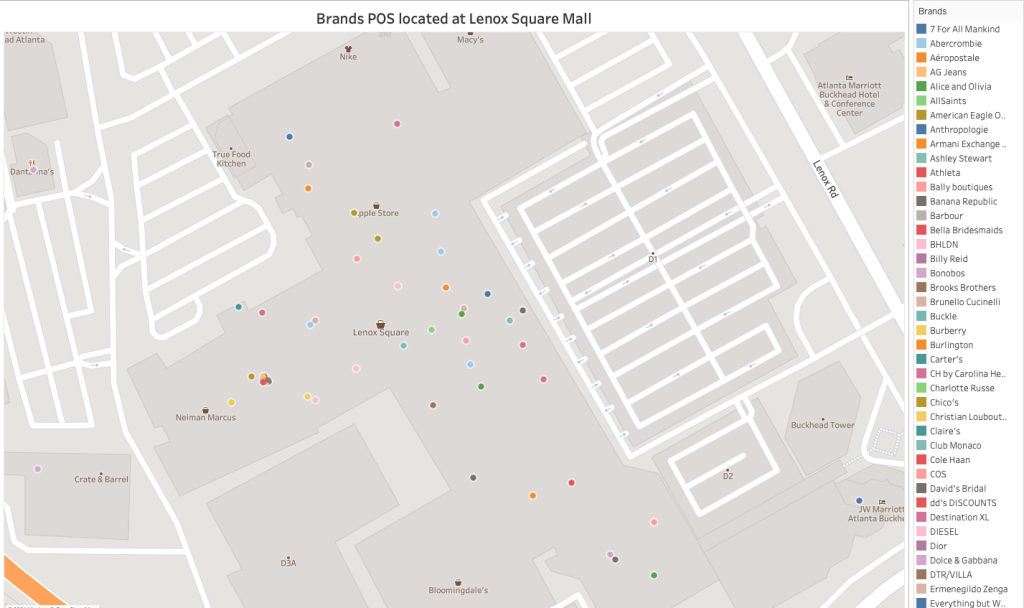
This analysis covers not only individual stores but also those establish inside shopping malls; an example of this is the Lenox Square mall, where we identified several clothing stores and analyzed how they were distributed inside the mall.
[button button_text=”Like what you see? Request a free DEMO” button_style=”style-1″ button_arrow=”true” button_rounded=”true” font=”Default” button_size=”medium” font_size=”” button_icon=”” button_align=”center” padding_v=”” padding_h=”” button_link=”/request_demo/” link_open=”_self” href_title=”” id=”” class=”” bg_color=”” text_color=”” border_size=”” border_color=”” border_radius=”” h_bg_color=”” h_text_color=”” h_border_size=”” h_border_color=”” h_border_radius=”” margin_top=”” margin_bottom=”” margin_left=”” margin_right=””]
Applying geo-marketing techniques we can visualize the foot traffic of consumers within a mall or individual store, as well as in its surroundings.
These solutions benefit any business sector. another example of this is a case study that was conducted to compare two of the most popular supermarkets in the city of Guadalajara, Jalisco Mexico. Read more about this case: “Walmart Vs. Soriana: Consumer Foot traffic Analysis.

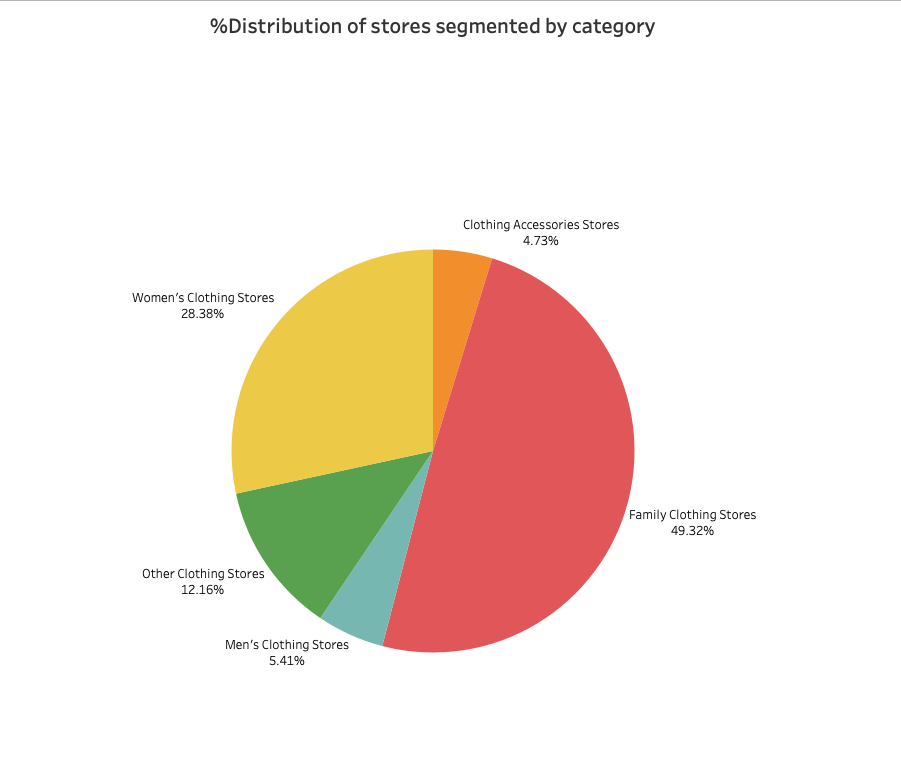
In this section we observe the percentage distribution of stores segmented by category, the result shows that the most popular category is family clothing with 49% of the market, followed by women’s clothing with 28% and other types of stores with 12%.

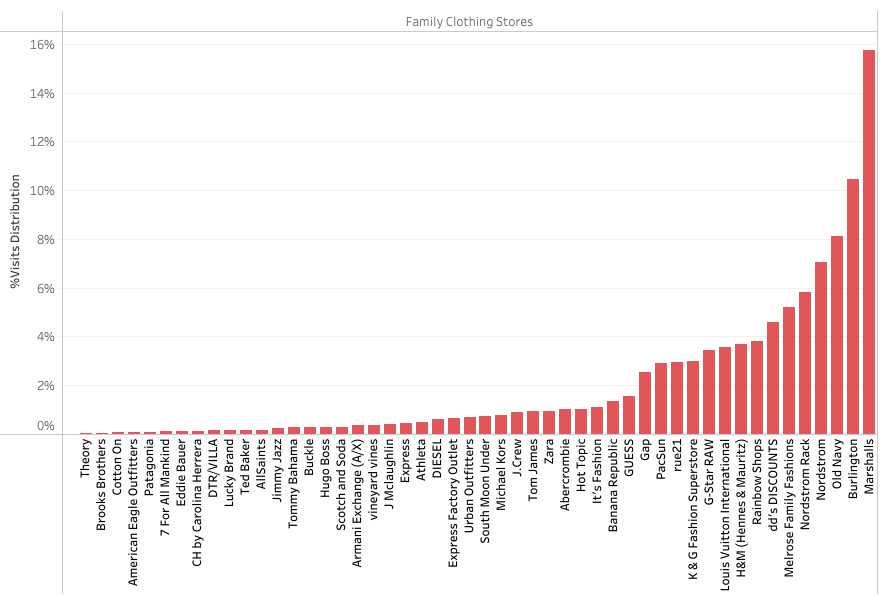
This is a brief analysis of the percentage distribution of visits in the family clothing stores category, allowing us to identify which are the most and least visited brands. Marshall’s clothing brand took first place, followed by Burlington’s and Old Navy, being these the three most predominant brands in the Atlanta clothing market.

By applying location intelligence to Big Data, it’s possible to find different points of interest such as competitors’ points of sale, the concentration of people, identify the most and least crowded places, the times and days of peak visitation, consumer purchase profiles, among others. This data helps companies to optimize the expansion and marketing strategies of physical stores, which answers several questions of how to ensure the success of an expansion plan such as:
- Where should I open my store?
- Where are my competitors located and who are they?
- Where do my customers come from?
- Who are my potential customers?
- How do people move in and out of my store?
At PREDIK Data-Driven we develop market intelligence solutions to help our clients to maximize their revenue and improve the position of their brands.
Do you need to implement location intelligence solutions in your business? Contact us!

