Location intelligence and footfall analytics can be valuable tools for wholesale distributors to maximize their revenue, optimize their processes and choose the best distribution routes for their pickup and last-mile delivery processes.
The correlation between foot traffic patterns, visitation, sales, and the success of wholesale food distribution companies has been studied and proven, so the development of this type of analysis has become a priority in the process of site selection, supply chain process optimization, and expansion modeling.
Case Study: Sysco Vs. US foods, Phoenix, Arizona, USA
At PREDIK Data-Driven we conducted a detailed study of two leading food distributor franchises in the restaurant industry in the state of Arizona, USA: Sysco and US foods, both located in the city of Phoenix.
In this case study, we analyzed the mobility patterns and foot traffic in and out of both establishments and their distribution centers, in order to understand the behavioral patterns of consumers and workers who had a record of visiting both establishments. This analysis aims to answer the following questions:
How are the visits distributed in the facilities?
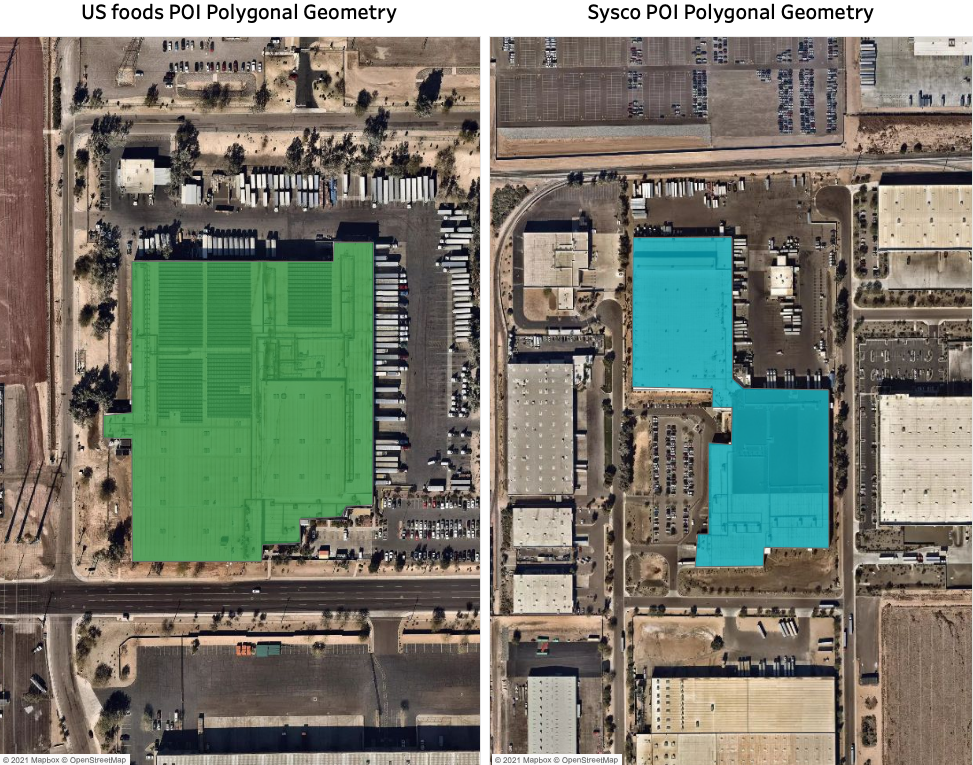
Through location intelligence, the points of interest are identified and a heatmap is applied in order to observe the internal distribution of consumers, workers, and visits inside both establishments.
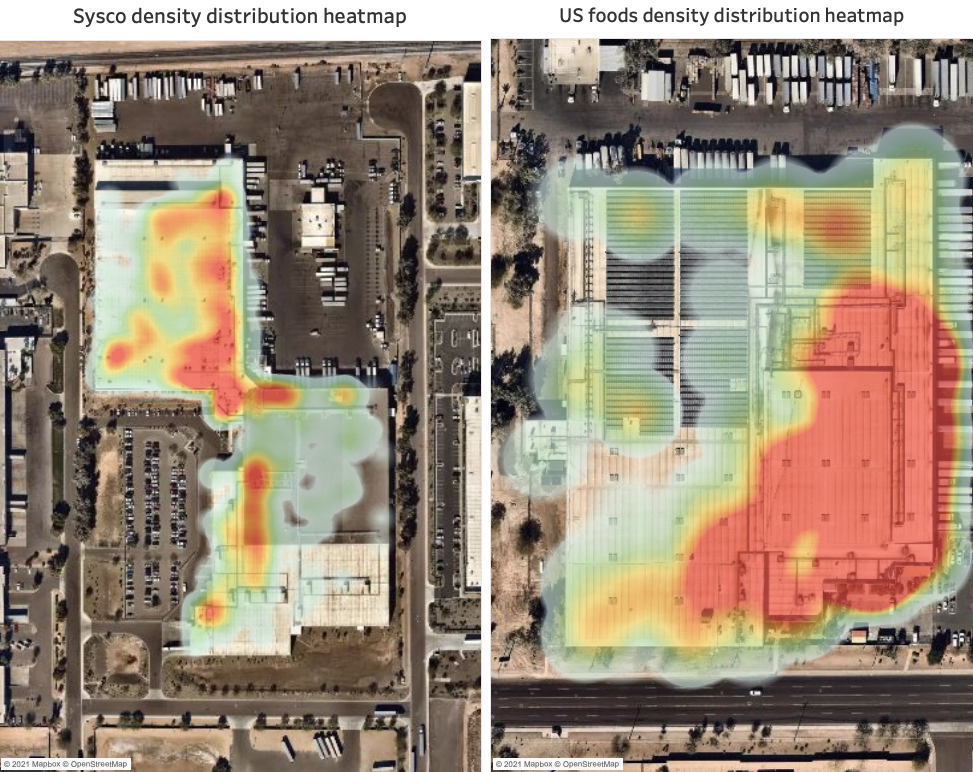
This provides very useful information when conceptualizing the design of the infrastructure and the internal architectural plans that make up each establishment so that leaders can implement strategies that improve both the operations in their distribution centers, as well as the customer journey, generating more efficient expansion models, maximizing the customer experience.
As we can see in the internal distribution, most of the mobility is concentrated at the extremities of the facilities where the collection and loading of products take place, as well as at the entrance of the location. With this type of analysis, franchises can optimize the processes in the supply chains, avoiding bottlenecks and maximizing their operating and work efficiency.
Which of the establishments has the most visitation activity?
Percentage distribution of visits recorded between December 12, 2020, and January 22, 2021:
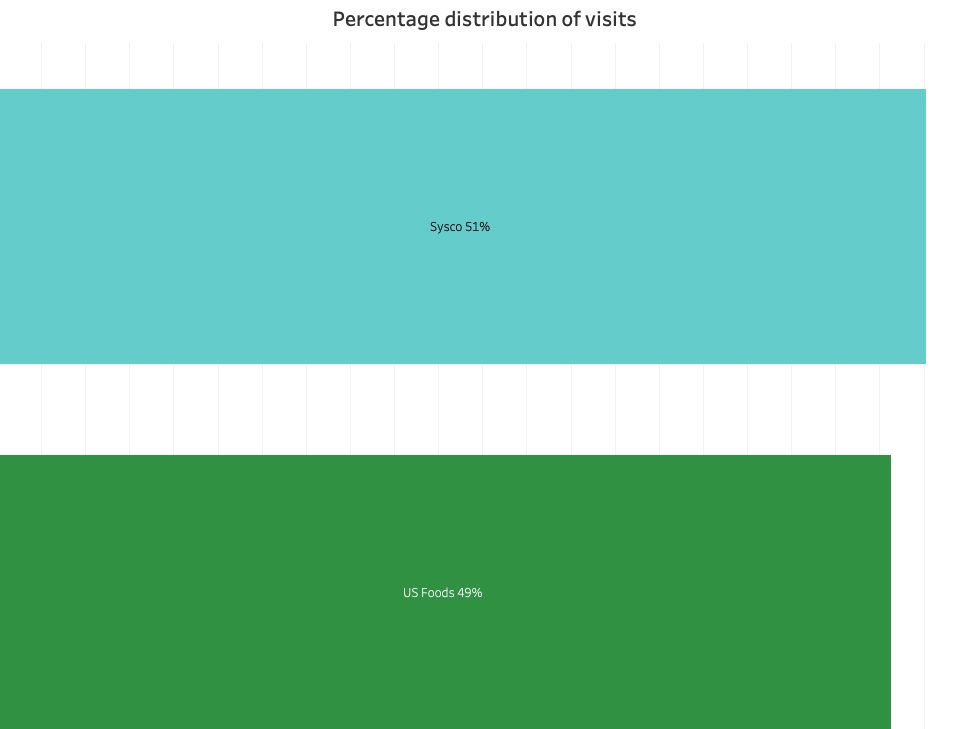
When analyzing the in-store mobility within both stores using a certain time period, we identified that 51% of visits were recorded at Sysco, while the remaining 49% were concentrated at US foods, which has a correlation with the location of the stores, the number of workers and the preference of consumers when it comes to choosing wholesale food products.
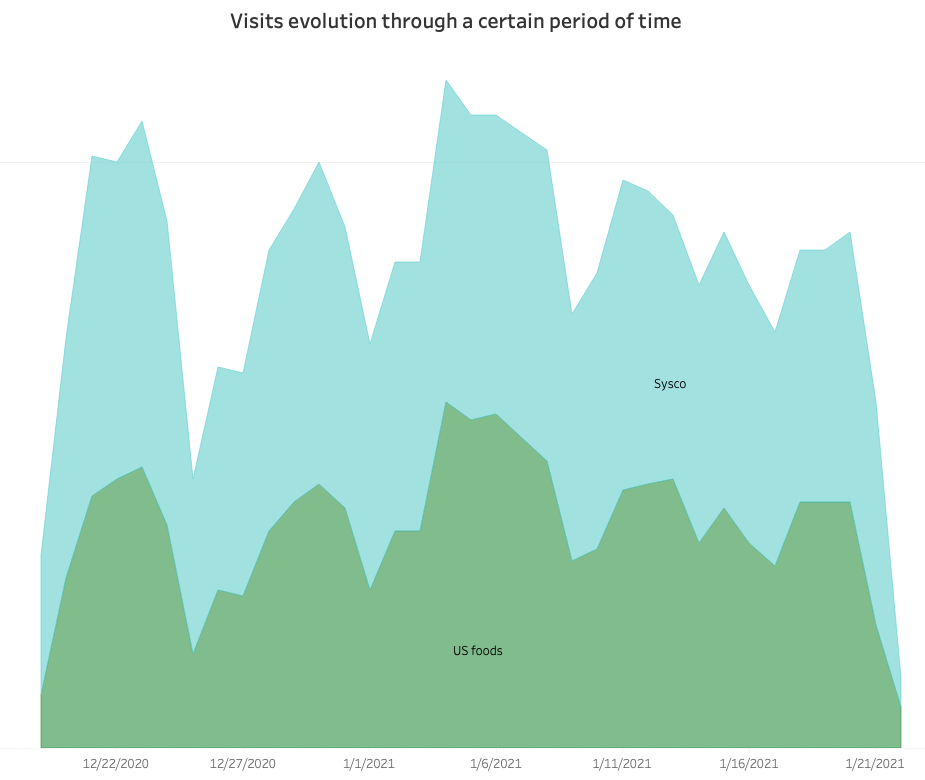
These analyses make it possible to observe the evolution of visits over time, which can be very useful to identify patterns of moving behavior of visitors and market trends in peak and off-peak seasons.
Understanding visitors’ behavioral patterns: Which days of the week are the most visited?
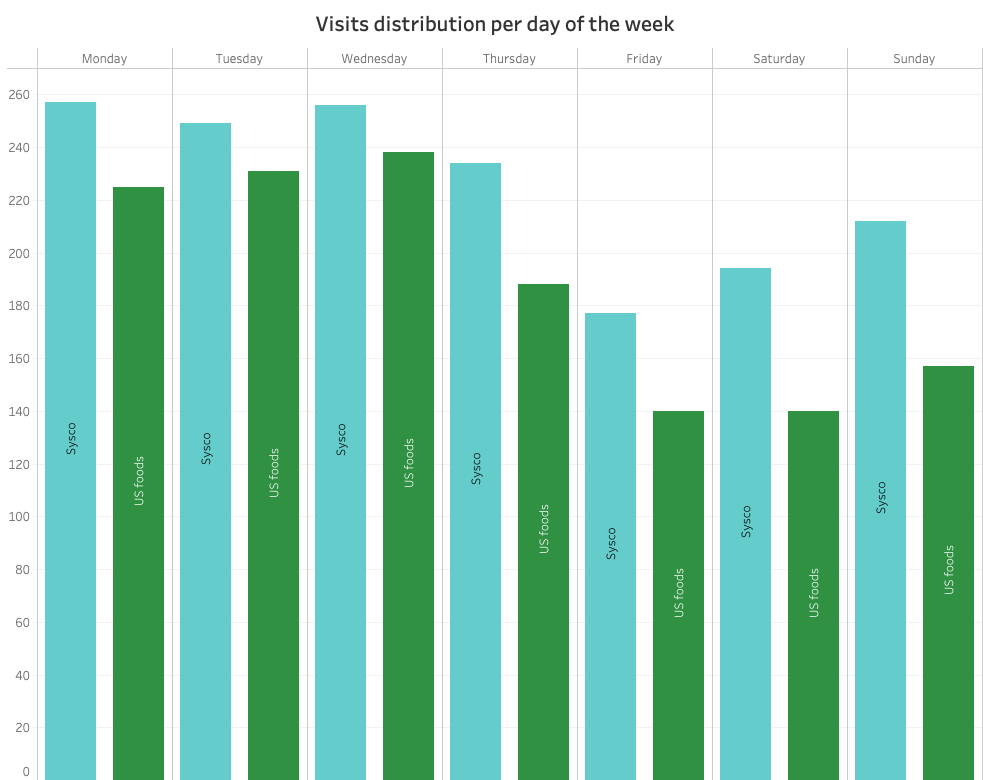
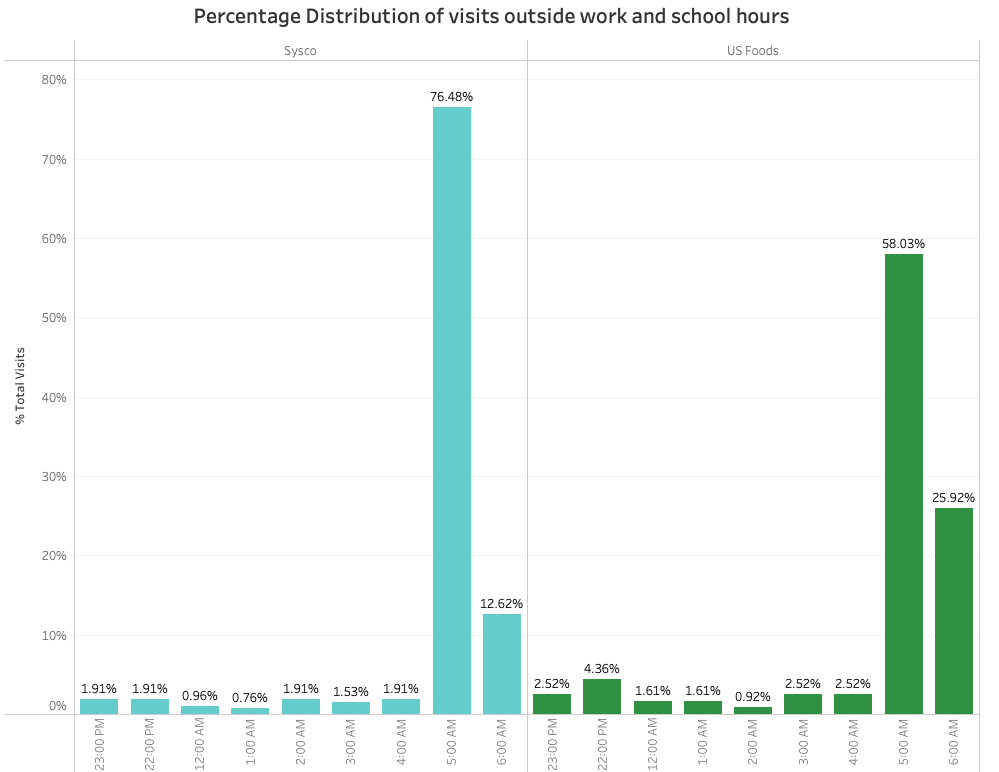
One of the most interesting applications of location intelligence and footfall analytics is that it allows knowing in detail by day, hour, month, or year the behavior patterns of the visits registered within a point of sale or interest, offering valuable knowledge to design marketing campaigns and commercial and operational strategies based on the power hours of both companies.
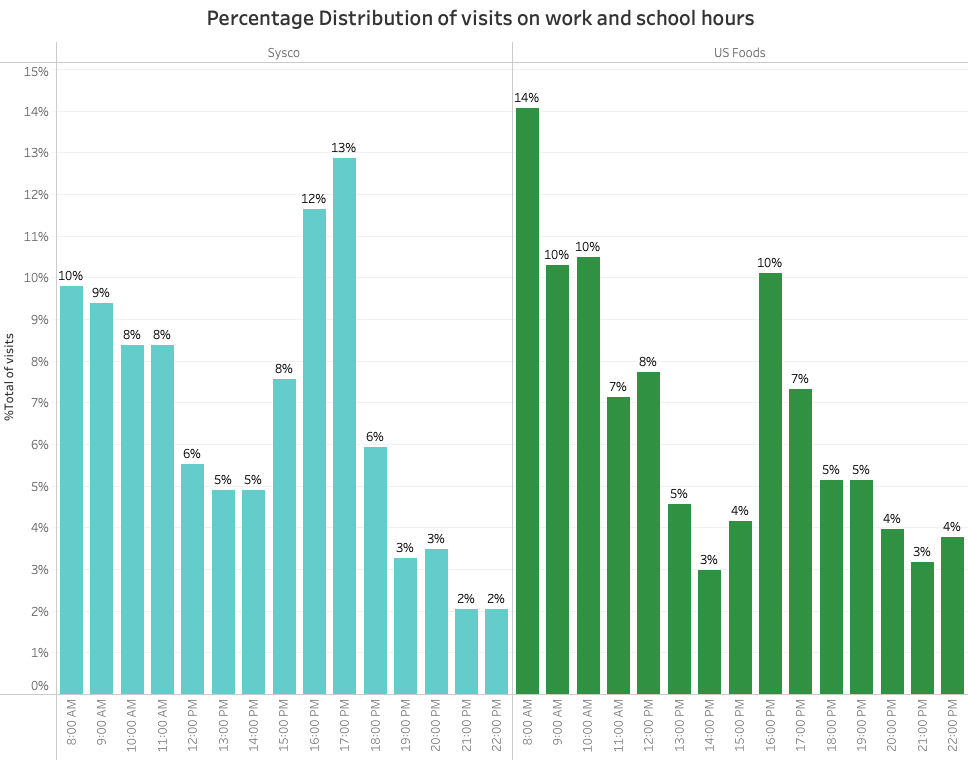
This analysis is very useful to know what is the performance of the stores at peak and off-peak hours of the day.
What is the foot traffic mobility pattern in the surroundings of both establishments?
Although visits are related to the performance of any wholesale location, they are not the only key factor for success. Another fundamental aspect that must be analyzed is the environment of the points of sale or distribution centers since it allows comparisons and estimates of the number of visits, revenues, strategic and operational movements of the competition.
By gathering information on the competition’s potential customers, it is possible to carry out a more detailed benchmarking and generate strategies to capture the competition’s customers.
These solutions benefit any type of business, an example of this is another case study that was conducted to compare two of the most popular home improvement stores in the city of Phoenix, Arizona, USA, the findings were more than interesting. Read more about this case: “Location analytics: Whole Foods Vs. Sprouts Farmers Market“
What are the benefits of footfall analytics and location intelligence for wholesalers?
These tools have revolutionized the way wholesalers implement the expansion, commercial and operational strategies
Through these analytics, businesses gain a detailed picture of their establishment performance, while predicting or estimating:
- Brand positioning
- Customer behavior
- Market trends
- Competitors revenue
- Expansion models (site selection)
By applying footfall analytics through spatial data mining, it is possible to collect valuable information such as:
- Quantity and classification of people visiting an establishment or area of interest
- Times and moments of the day where there are more visitors
- Dwell time
- Visitation count in-store and out-store
- Market potential of POS and POI’s
- More efficient distribution routes
- Optimization of last mile delivery processes
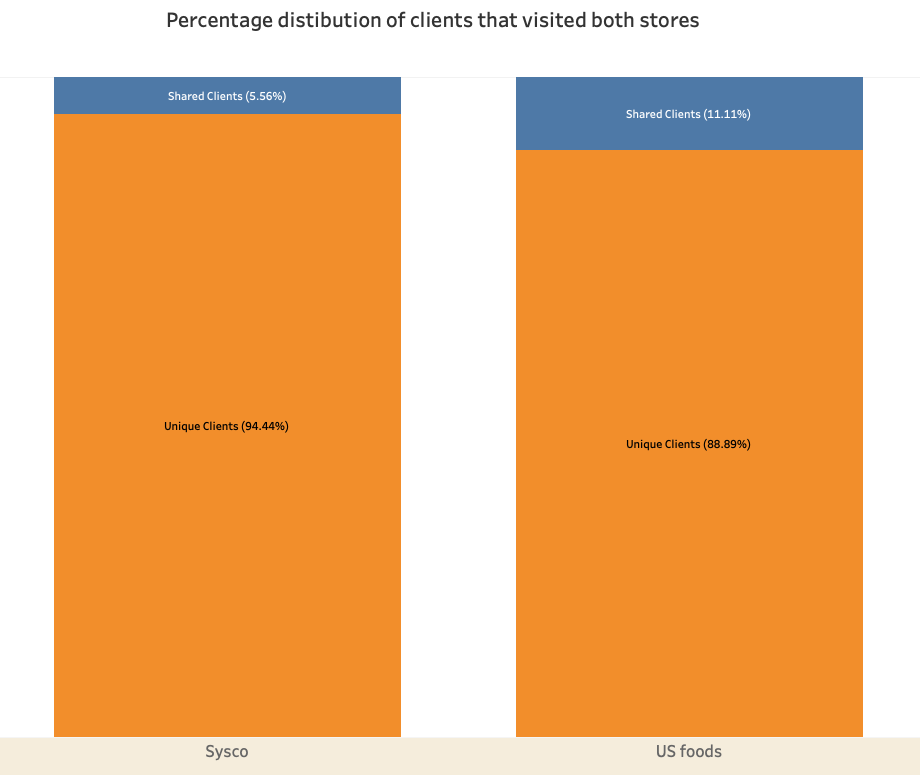
Customer Analytics
With this analysis, it’s possible to infer in which other places (stores, restaurants, shopping malls, residential areas, among others) the people who were at a point of interest also visited. Thus, Sysco and US foods can analyze how their customers behave, since they can look where and how long they were before and after visiting the facilities.
Identifying ideal areas in expansion and site selection strategies
With mobility data, it’s possible to clearly understand the behavior of the people who pass through a given area, how they’re alike, their tastes, preferences, socioeconomic level, and purchasing potential. Including an in-depth analysis of the commercial establishments in the area in question, becomes a crucial factor in determining the best locations for the opening of establishments.
What is the revenue potential of my competitor?
Through machine learning models, it’s possible to predict the revenue and visits of a competitors´ store. With these tools, Sysco could get to estimate the revenue of its competitor US foods in a specific week, month, or year. These models can also be used, for instance, to predict the potential success of a coffee shop that is about to open.
All these insights are generated by applying location intelligence and mobility analysis, if you are interested in knowing more about these insights, we conducted a POI characterization case study of Bangalore, India: POI Analytics: Uses and Applications
