Footfall analytics and location intelligence play a critical role in every business since they help to understand the behavioral patterns of consumers in any given area of interest or point of sale.
Foot traffic analysis, location intelligence, and POI analytics are revolutionizing the way retail and wholesale industries implement commercial, operational, and expansion strategies in the pharmaceutical sector.
Thanks to these analyses, businesses can obtain a more detailed overview of the performance of their stores, while predicting or estimating brand positioning, customer behavior, market trends, turnover, and growth expansion models (site selection), both their own and those of their competitors.
By applying footfall analytics techniques through spatial data mining, it becomes possible to collect valuable information about the number and classification of people visiting a store or area of interest, the hours and times of day where there is more people, the dwell time inside the stores, the number of visits, the market potential of points of sale or other points of interest (POI), etc., leaders can use this information to make more efficient and accurate decisions that generate greater profitability by maximizing revenue and optimizing costs.
The correlation between foot traffic mobility, visitation, sales, and the success of pharmaceutical franchises has been studied and proven, so the development of this type of analysis has become a priority in the site selection and growth expansion modeling process for retailers.
Case Study: San Pablo Vs. Guadalajara drugstores, Mexico City
At PREDIK Data-Driven we conducted a detailed study of two popular drugstore chains in Mexico City, Mexico, San Pablo, and Guadalajara Drugstore, both located in the same avenue.
In this case study, we analyze the movement and foot traffic in and outside both drugstores, with the objective of understanding the behavioral patterns of consumers visiting both brands. This analysis aims to answer the following questions:
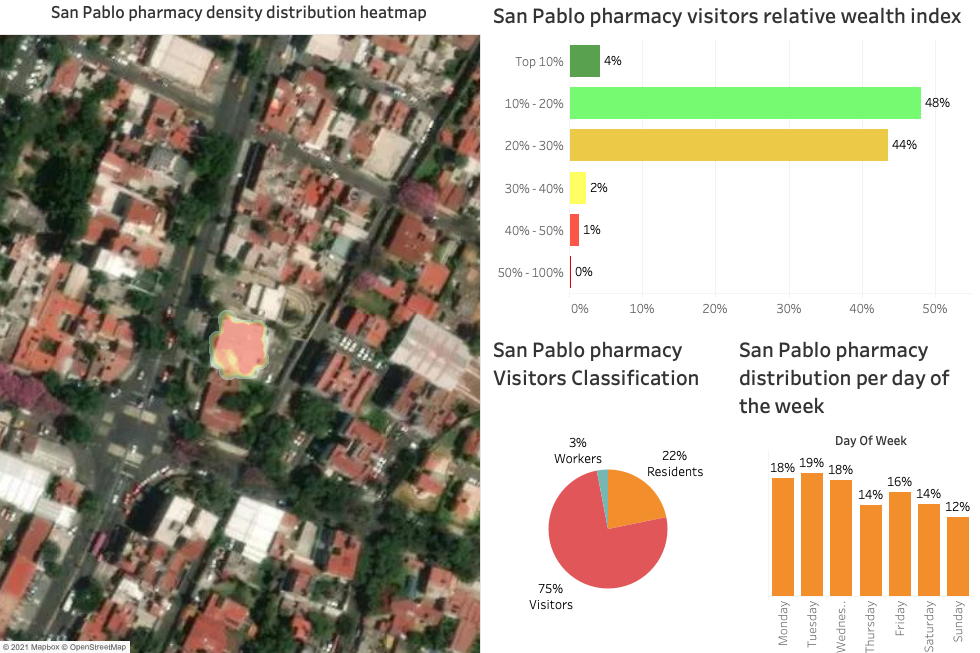
How are visits being distributed inside the drugstores?

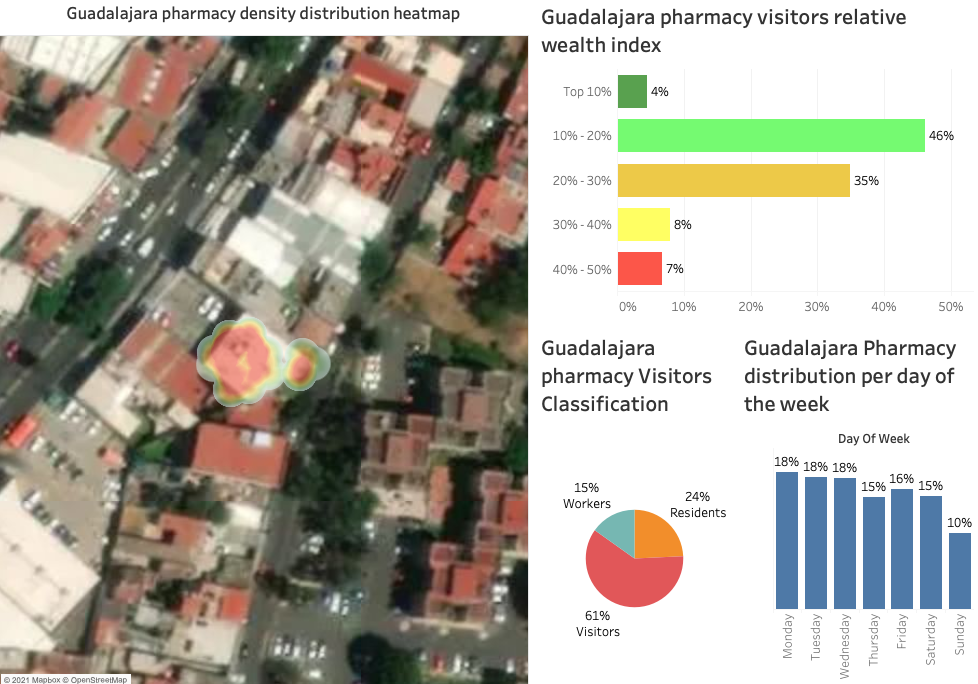
By applying location intelligence, we locate the points of interest and generate a heat map based on the visitor’s mobility patterns, which allows us to observe the internal distribution of the customers.
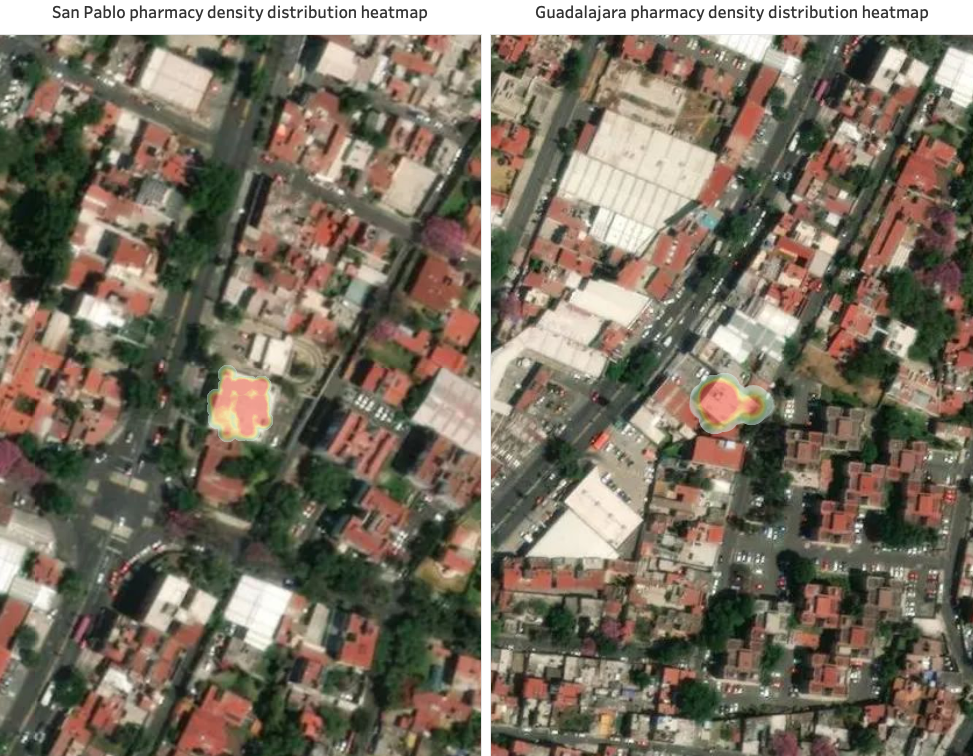
This provides very useful information when conceptualizing the design of the infrastructure and internal architectural plans that conform to each store, allowing leaders to implement strategies that improve the customer journey and implement more efficient growth expansion models while maximizing customer shopping experience and sales conversion.
Which store is the most visited?
Percentage distribution of visits recorded in the month of December 2020:

After analyzing the mobility patterns within both pharmacies using the established time period, we identified that 82% chose to visit San Pablo drugstore, while the remaining 18% preferred Guadalajara’s, which has a correlation with the location of the stores and the preference of consumers when it comes when purchasing health products.
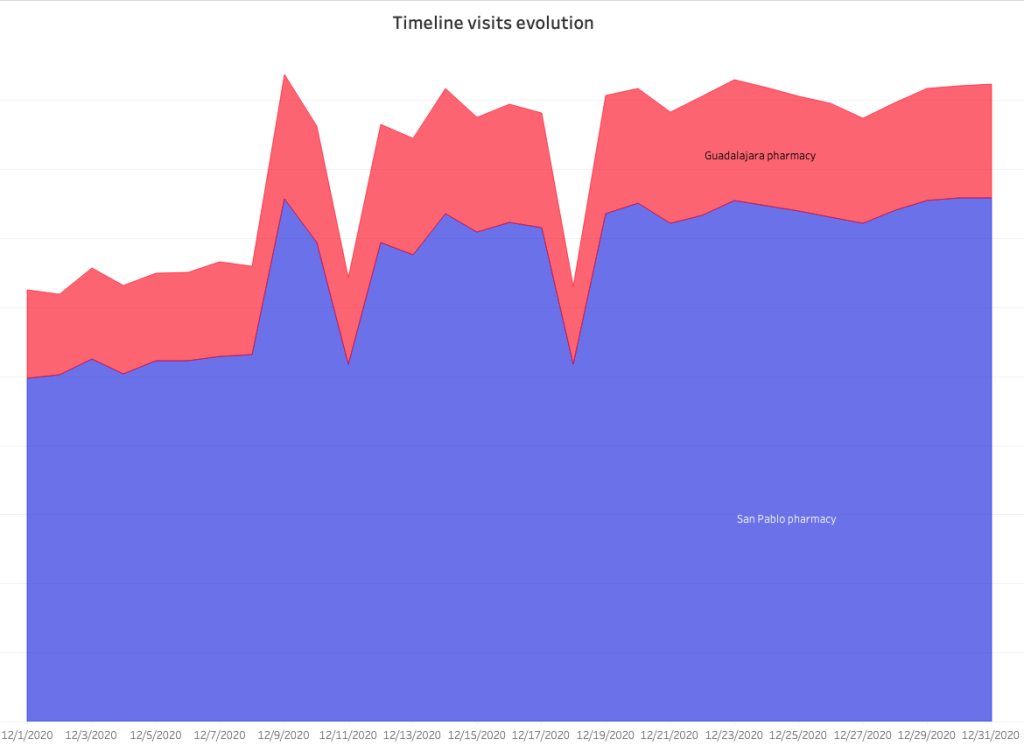
With this, it also becomes possible to monitor the evolution of visits over time, which can be very useful to identify mobile customer behavior patterns and market trends in high and low traffic seasons.
What days of the week are the most visited?
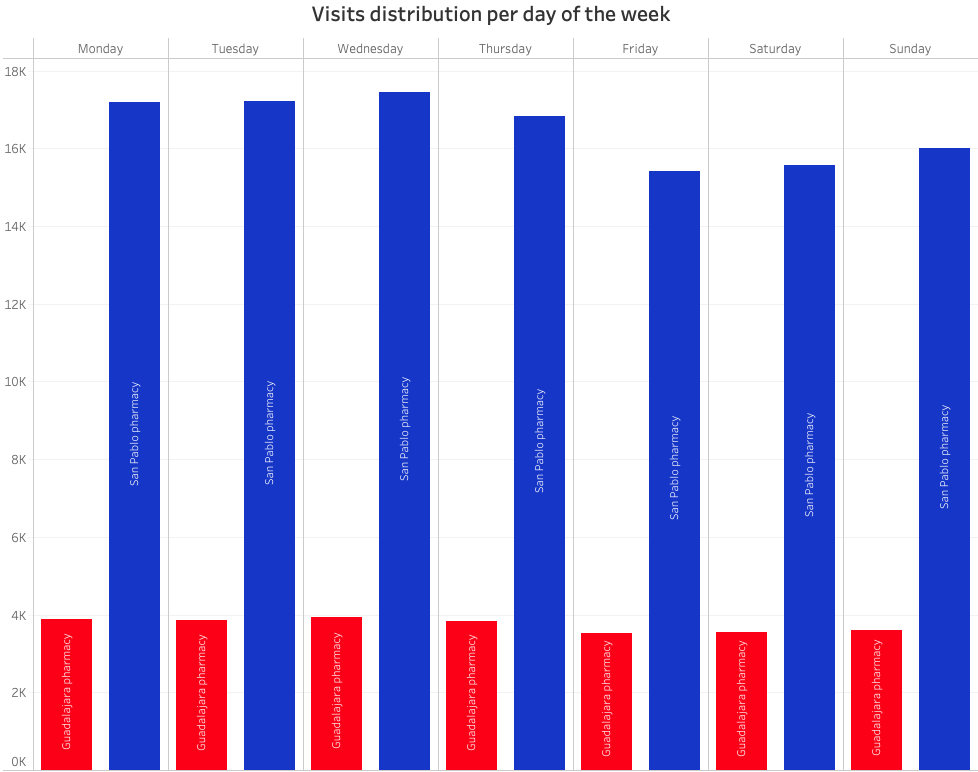
One of the most interesting applications of footfall analytics is that it allows to understand in detail the day, hour, month, or yearly consumer behavior patterns, offering valuable insights to design marketing campaigns and commercial strategies based on pharmacies’ power hours.
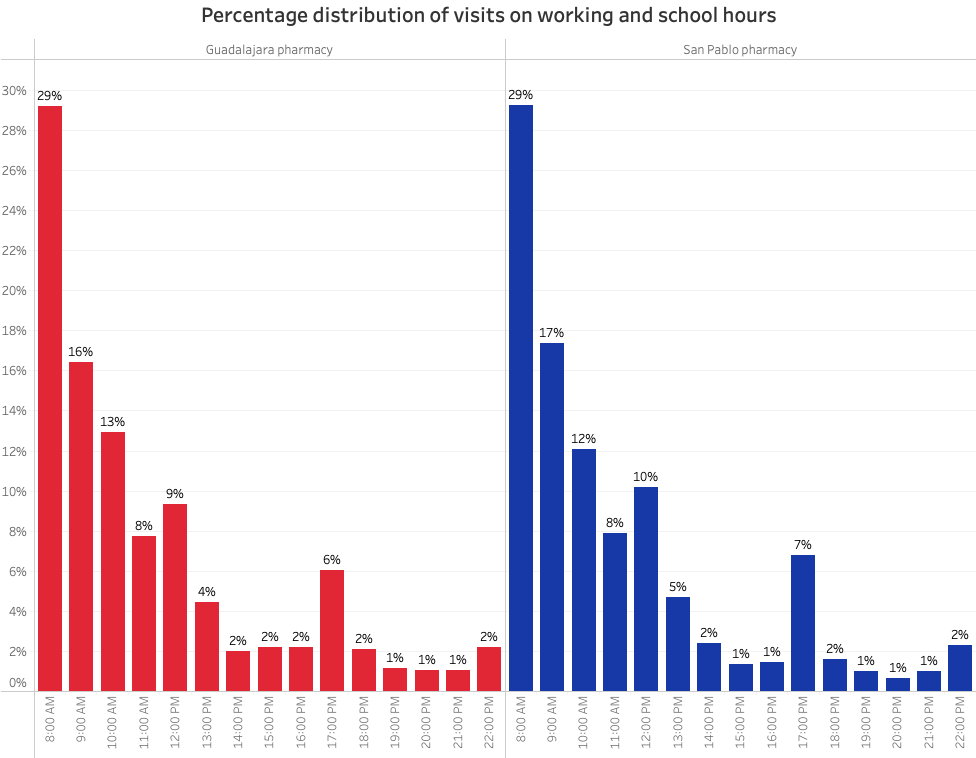
This analysis is very useful to measure the performance of the establishments during the most active hours of the day.
How is the foot traffic mobility pattern around both pharmacies?
Although foot traffic is related to the performance of any retail location, it is not the only key factor for success. Another fundamental aspect that must be analyzed is the environment of the outlets, as it allows for comparisons and estimates of the number of visits, potential revenues, strategic and operational movements of the competition.
By gathering information on the competition’s potential customers, it is possible to carry out a more detailed benchmarking and generate strategies to capture the competition’s customers.
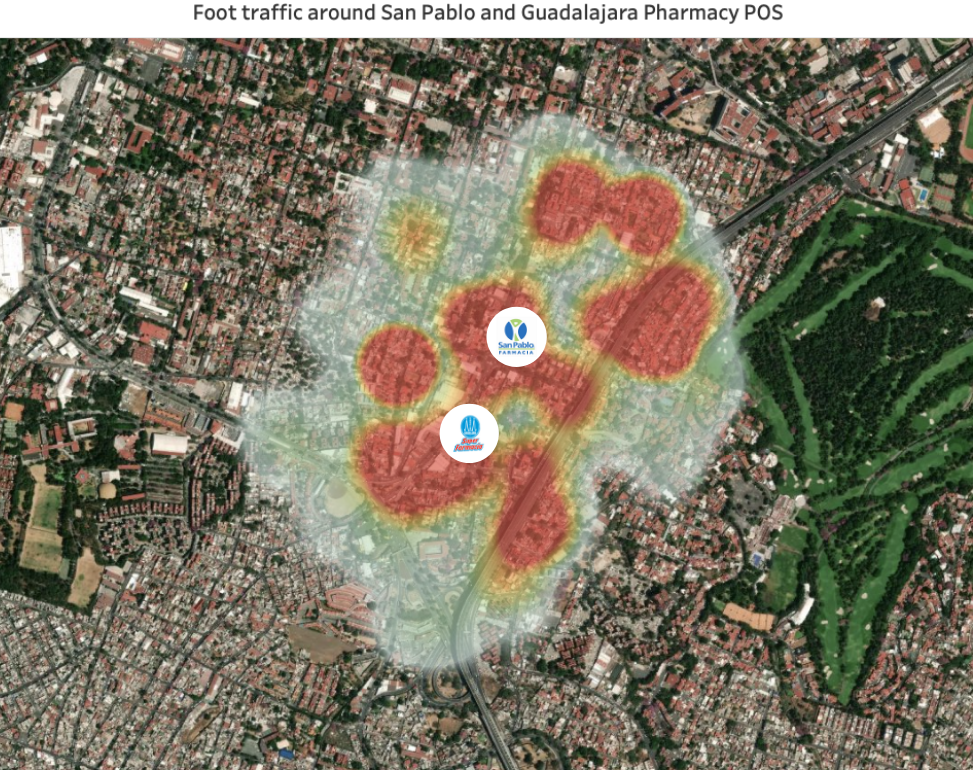
This environmental analysis provides us with a more complete picture of the surrounding areas and people’s mobility patterns. This data, combined with other elements, provides deep insight into predicting the revenues of any retail establishment.
What other insights can be gained by analyzing footfall at a retail outlet?
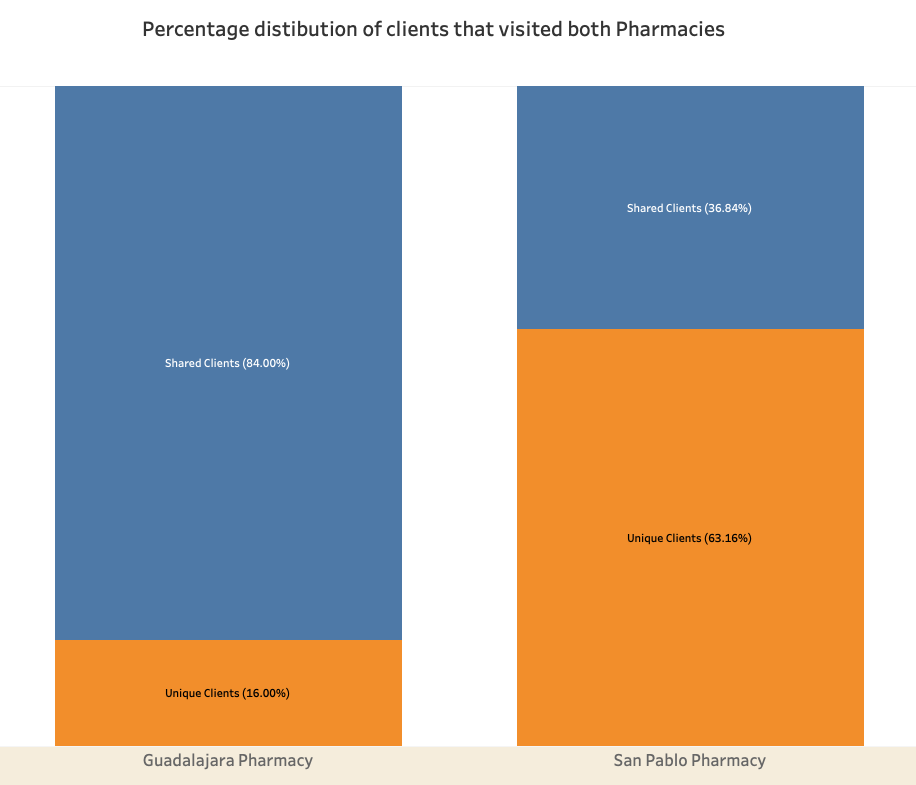
Understanding which customers visit both drugstores
By analyzing data over a given period of time at a specific location, such as a drugstore, the percentage distribution of consumers who visited the stores can be estimated.
These solutions benefit any type of business, an example of this is another case study that was conducted to compare two of the most popular supermarkets in the city of Phoenix, Arizona, USA, the findings were more than interesting. Read more about this case: “Visits battle: Whole Foods Market vs. Sprouts Farmers Market“
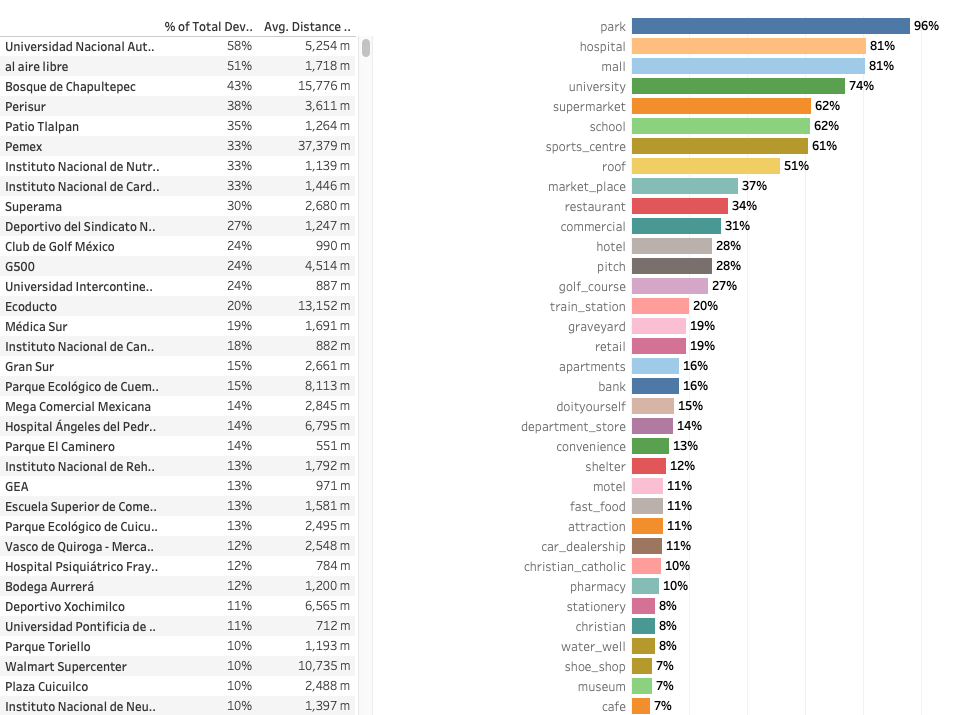
Customer profiling
Another possible analysis is customer profiling since it provides information on which other places (stores, restaurants, shopping malls, residential areas, among others) the people who visited an establishment have been to. Therefore, both brands can know how their customers behave and know where and how much time they spent inside and after visiting a pharmacy.
Identify optimal areas to establish new points stores
With data from the Wealth Index Global, collected by Facebook, it is possible to estimate the socioeconomic levels of the inhabitants, their age, and their profile. At the same time, by applying geospatial data analysis techniques, corporate buildings, residential areas, schools, etc. can be located, which makes it possible to clearly understand the behavior of the people who pass through a given area, their tastes, preferences, socioeconomic level and purchasing potential.
What is the turnover potential of my competitor or a POS?
Through machine learning models, it is possible to predict the turnover of a given point of sale. With these models, Guadalajara drugstores could get to know what is the potential turnover or visits of its competitor San Pablo in a specific week, month, or year. These models can also be used to predict the potential of a new location to be opened. This is ideal to complement feasibility studies of site selection and expansion plans.
All these insights are generated by applying location intelligence and mobility analysis, if you are interested in knowing more about these insights, we conducted a POI characterization case study of Zona Rosa in Mexico City.
[button button_text=”Like what you see? Request a free DEMO” button_style=”style-1″ button_arrow=”true” button_rounded=”true” font=”Default” button_size=”medium” font_size=”” button_icon=”” button_align=”center” padding_v=”” padding_h=”” button_link=”/request_demo/” link_open=”_self” href_title=”” id=”” class=”” bg_color=”” text_color=”” border_size=”” border_color=”” border_radius=”” h_bg_color=”” h_text_color=”” h_border_size=”” h_border_color=”” h_border_radius=”” margin_top=”” margin_bottom=”” margin_left=”” margin_right=””]
