
Points of Interest (POI) data refers to the digital representation of physical locations that people may find helpful or interesting. Commercial places like restaurants, shops, and hotels can be considered Points of Interest. Also, a POI can be a public place such as a park, museum, school, or a hospital.
POI data has become essential to many applications across industries like retail, real estate, logistics, tourism, urban planning, and more. Also, analysts rely on point of interest (POI) data to understand how specific places are used, the type of audience they attract, and how their visitor profile changes over time.
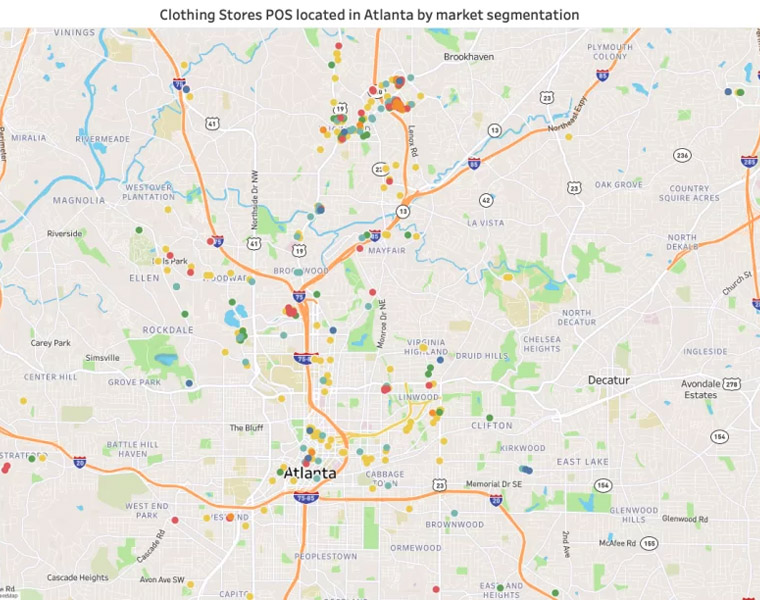
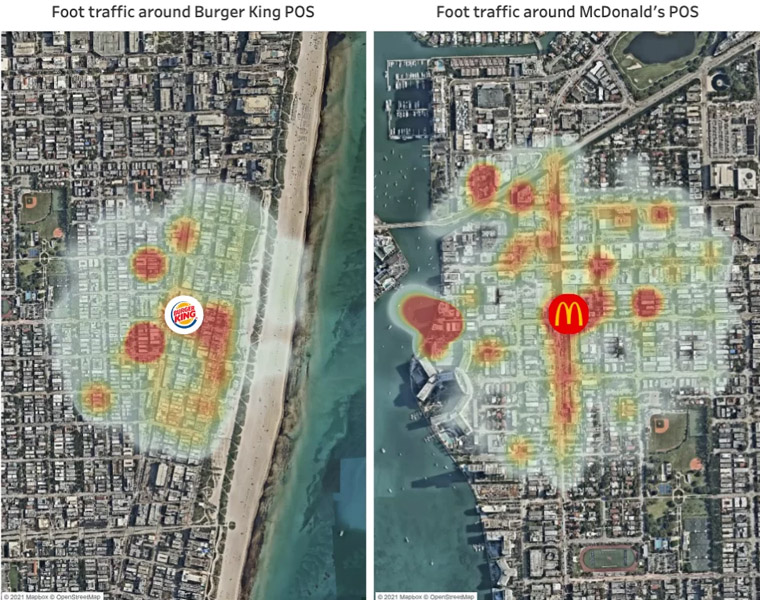
Retailers, for instance, are using POI data in combination with other data sources to assess the performance of their points of sale in terms of visitation volumes and conduct market research. Similarly, consumers leverage POI data using apps like Google Maps, Foursquare, or Tripadvisor to get directions, read reviews, find great restaurants, and explore local attractions.
In this guide we will cover the following topics:
So, what is Point of Interest (POI) Data?
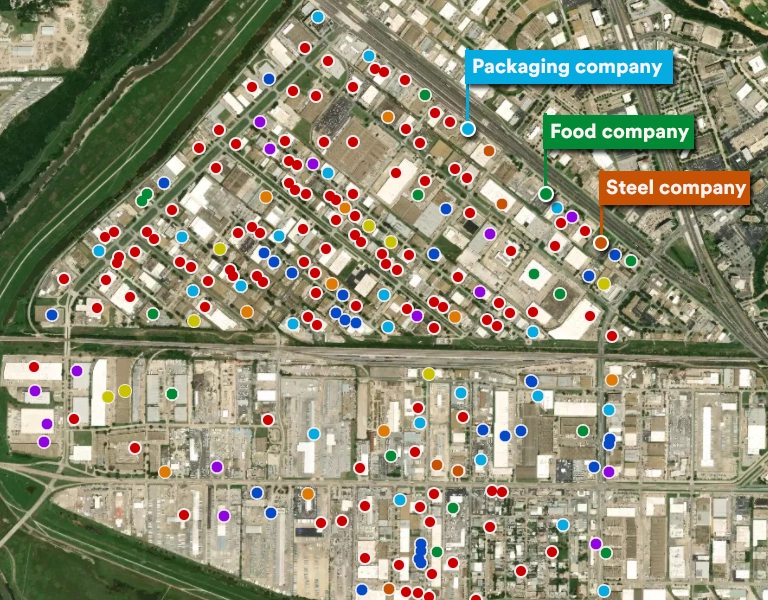
Points of Interest (POI) data usually consist of geographical coordinates, such as latitude and longitude, street addresses, and venue industry categories.
Different systems can be used to determine industry categories, including NAICS (the North American Industry Classification System), which codes businesses based on their primary activities, or Google Maps POI categories. Apart from this, POI data can also include information about area attributes, including traffic patterns and infrastructure.
In addition, it includes other valuable information like the venue type (For example, “store” or “restaurant”). But POI data isn’t just about the venue itself. It can provide context about the surrounding area. For example, it can include details about events and attractions.
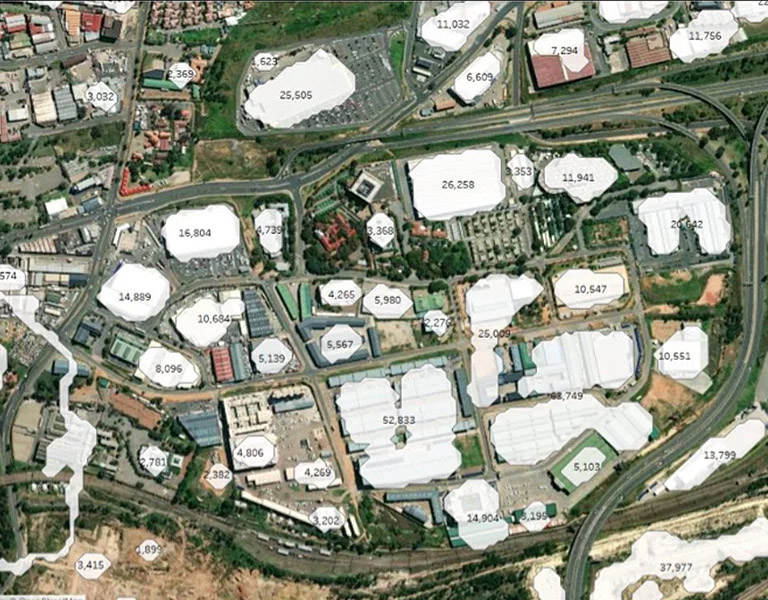
In a more advanced stage, these data can even provide insights into the visiting volume during specific times and their staying duration.
When combined with customer analytics techniques based on mobility data, businesses can answer questions like:
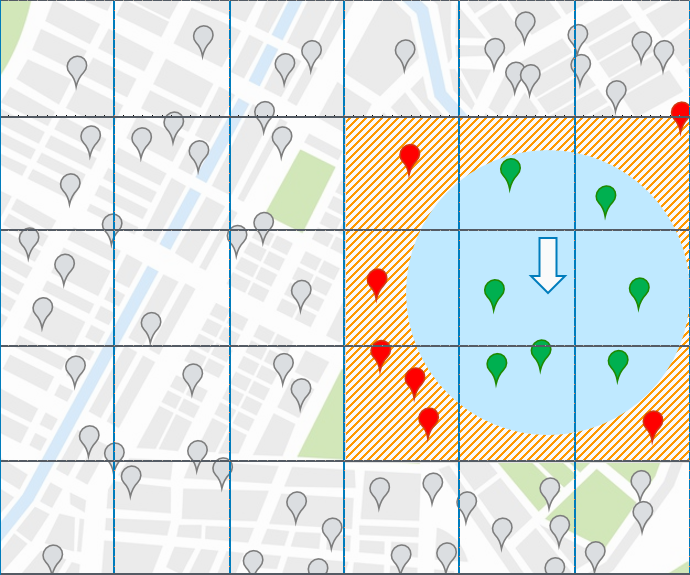
- How many people are in the radial vicinity of a POI?
- What are consumers’ preferences for living or residing near or within the POI?
- How is pedestrian mobility within a POI?
- What is the relative wealth index level of people living in or visiting a specific POI?
Are you looking for enriched geospatial data? Our dataset provides comprehensive and enriched information about the business, commercial, and industrial aspects of any specific region in the world. The data includes Point of Interest (POI) data and foot traffic, containing over 50 variables. Learn more>>
Importance of POI Data for businesses and data teams
Point of Interest data is like a “digital fingerprint” of a location, providing unique details about that place. The information it delivers can go beyond just an address or GPS coordinates. Using the power of Location Intelligence and GIS Mapping, this data can tell us so much about consumers, competitors, and the overall market.
For example, Point of Interest data is essential to optimize marketing performance, develop site location models, analyze market share, or optimize supply chain logistics. Some use cases can be:
Store performance analysis: For businesses, especially retailers, POI data can be a goldmine of insights. Data like these are useful to understand how well a store or outlet performs.
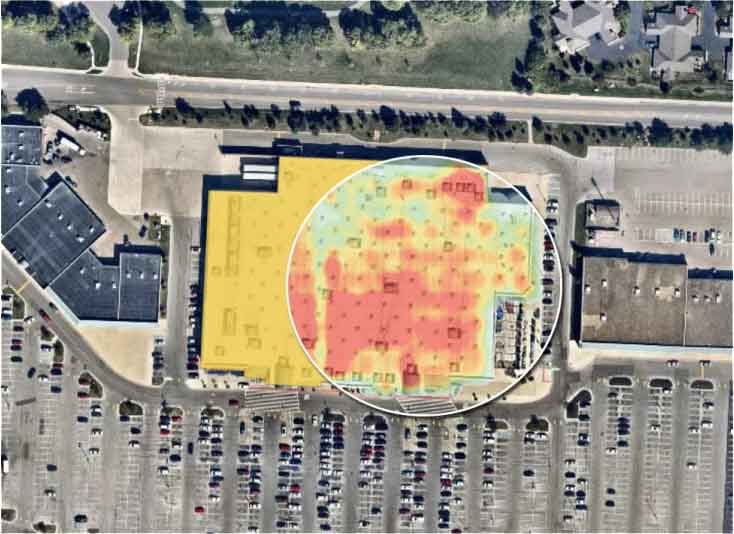
Consumer analytics: Point of Interest analytics is also valuable when understanding how users behave. Point of Interest databases provide insights into what places our target consumer visits, how long they stay in a specific place, or how they move. This kind of information makes all the difference for marketing and sales teams. Learn more about customer analytics
Improve logistic processes: By providing information on specific locations, their characteristics, and the activity patterns around them, POI data can help improve route planning, optimize delivery times, and assist in strategic decision-making.
Site selection: Finding the “perfect” place for a new store, office, or branch is key to success. Whether it is a site selection strategy or an expansion plan, POI data can provide the necessary insights to identify the right location according to specific needs.
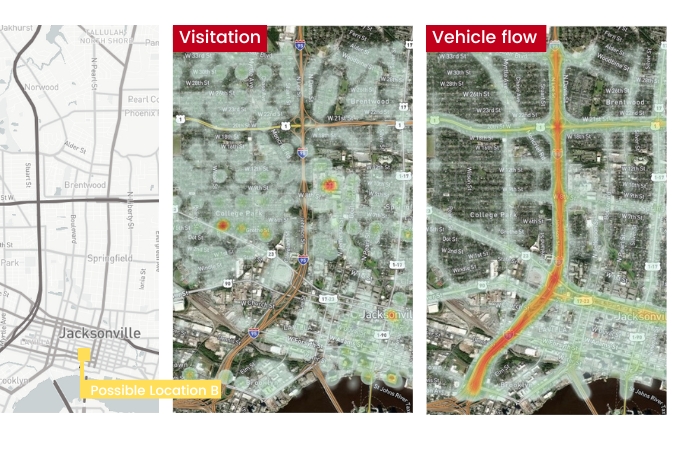
Point of Interest Use Case: Learn how a bakery brand uses site selection analytics to locate new bakehouses
Analyzing an area: Trade area analysis can be simplified using specialized tools based on POIs.
Geofencing: Businesses can send potential customers personalized messages and content through push notifications and ads. Learn more about Geofencing

Real estate investment: Brokers and investors can analyze an area’s development to find the ideal places to invest. Learn more about Real Estate Analytics
Where does POI Data come from?
Point of Interest (POI) data can come from different sources, each bringing unique insights (And unique challenges). Here are some examples:
User-Generated Data, Web, and Media Platforms
Location data collected from social media check-ins and other user activities are also a source of POI data. However, this data’s accuracy is not guaranteed and may be influenced by hardware, application settings, and user errors.
Using web scraping tools, POI data can also be extracted from web sources like Google Maps. The data acquired usually requires preparation before analysis.
Onsite Data
Gathering data on location through field representatives provides high-quality and accurate information. This method is commonly used for creating first-party POI databases but can be time-consuming and expensive.
Official Government Sources
Official records from government institutions offer valuable data, though access might be limited due to privacy regulations. This source might not cover new, temporary, or upcoming POIs, thus requiring supplementation with other data sources.
Geocoding
This provides location information for a comprehensive overview of all POIs in a particular area. However, this data must be increased with other POI data to offer a complete picture.
Public Directories
Postal addresses provided by businesses during their registration process can form a POI dataset. The data might become outdated if companies change locations and fail to update their information.
Manual Verification
Some providers hire individuals to manually maintain their POI databases by physically adding or verifying locations. While ensuring accuracy, this method avoids privacy infringements associated with user data collection.
How is POI data represented?
There are different formats to place POIs on a map, each with a unique data representation and granularity. These formats allow POI attributes to define a place on a map and its spatial relationship with surrounding places.
Coordinates
Geographic positions of a location are commonly expressed in latitude and longitude (Lat/Long) and are called coordinates.
These coordinates help identify a Point of Interest (POI). The latitude and longitude aspect for a POI can come from sources like satellite-based mapping services or collected using GPS-enabled devices such as smartphones, fitness trackers, and tablets, among others.
Postal Codes
Another way to locate a point of interest (POI) is through its physical address, which typically includes a government-assigned postal, pin, or zip code. Unfortunately, there is no standard global system for postal codes.
Geohash
Geohash is a system that uses a unique alphanumeric string to pinpoint any location on Earth. It encodes and reduces the coordinates into a string of letters and digits.
Geohash uses grids for spatial indexing, increasing precision with each added grid. It can precisely identify a Point of Interest (POI), making complex analysis faster and more cost-effective.
H3
H3 is a geospatial indexing system developed by Uber that uses hexagonal grids to optimize ride pricing and dispatch. It is open-source, effective for radial lookups, great for calculating the distance between two locations, and enables circular geofences.
The main challenges of data quality
POI data is not “standard” around the web. Datasets can vary in their accuracy, relevance, standardization, and consistency.
Accuracy: Depending on the sources, collected POI data might be incomplete or imprecise. These inaccuracies can lead to misguided analysis, affecting critical decisions and long-term planning. That is why it is important to validate information across multiple sources.
Relevance: Data can be influenced by seasonal factors and sudden external factors (Such as the pandemic). It is crucial to ensure data remains relevant and accurate; otherwise, it could lead to inaccurate insights.
Standardization: Datasets from different vendors could be incompatible with each other or a particular data model. Verifying attribute compatibility and format requirements is essential.
Consistency: Not all sources similarly identify a location as a Point of Interest. For example, a manufacturing plant might be significant in an industrial listing but not a retail one.
Further, categorization can also vary across datasets, adding another layer of potential inconsistency.
How to make the most out of these data?
PREDIK Data-Driven uses trustable and high-quality data sources from authorized global vendors in compliance with GDPR, CCPA, and all other legal regulations.
Also, our unique methodology combines AI, Machine Learning, Data Science, and an expert team of experts to ensure our POI-based solutions can provide the best location intelligence solutions for you.